

Top
Author
Published
1 Oct 2026Form Number
LP2542PDF size
25 pages, 2.4 MBSubscribed to LP2542.
Thank you for your feedback.
Abstract
As AI workloads scale across the enterprise, GPU capacity has become one of the most valuable and most contested resources in the data center. NVIDIA Run:ai, deployed as part of the Lenovo Hybrid AI Factory, gives IT and platform teams the ability to share, partition, and dynamically allocate GPU capacity across many teams and workloads on the same physical infrastructure.
In this brief, we present a technical validation of Run:ai's two core GPU-sharing mechanisms, fractional GPU sharing and NVIDIA Multi-Instance GPU (MIG) partitioning, on Lenovo ThinkSystem SR650 V3 servers with dual NVIDIA H100 NVL GPUs. Using a sustained FP16 matrix-multiplication workload with saturated GPU memory and a synchronized-start measurement methodology, we characterize per-tenant throughput, aggregate throughput, and physical GPU placement behavior across a range of tenant counts for both mechanisms, and present a controlled, matched-scale comparison between them.
The results provide practical guidance on how customers evaluating Run:ai on Lenovo infrastructure can configure and size GPU sharing for their own multi-tenant workloads.
Introduction
Designing a multi-tenant AI platform involves deciding how best to share a fixed pool of GPU capacity across many teams and workloads without sacrificing performance or isolation. Left unmanaged, GPUs are frequently underused, reserved by a single team even when idle, or unable to be shared safely across projects. NVIDIA Run:ai addresses this by providing an orchestration layer on top of Kubernetes that allows GPU capacity to be shared, partitioned, and dynamically allocated across many concurrent workloads on the same physical infrastructure.
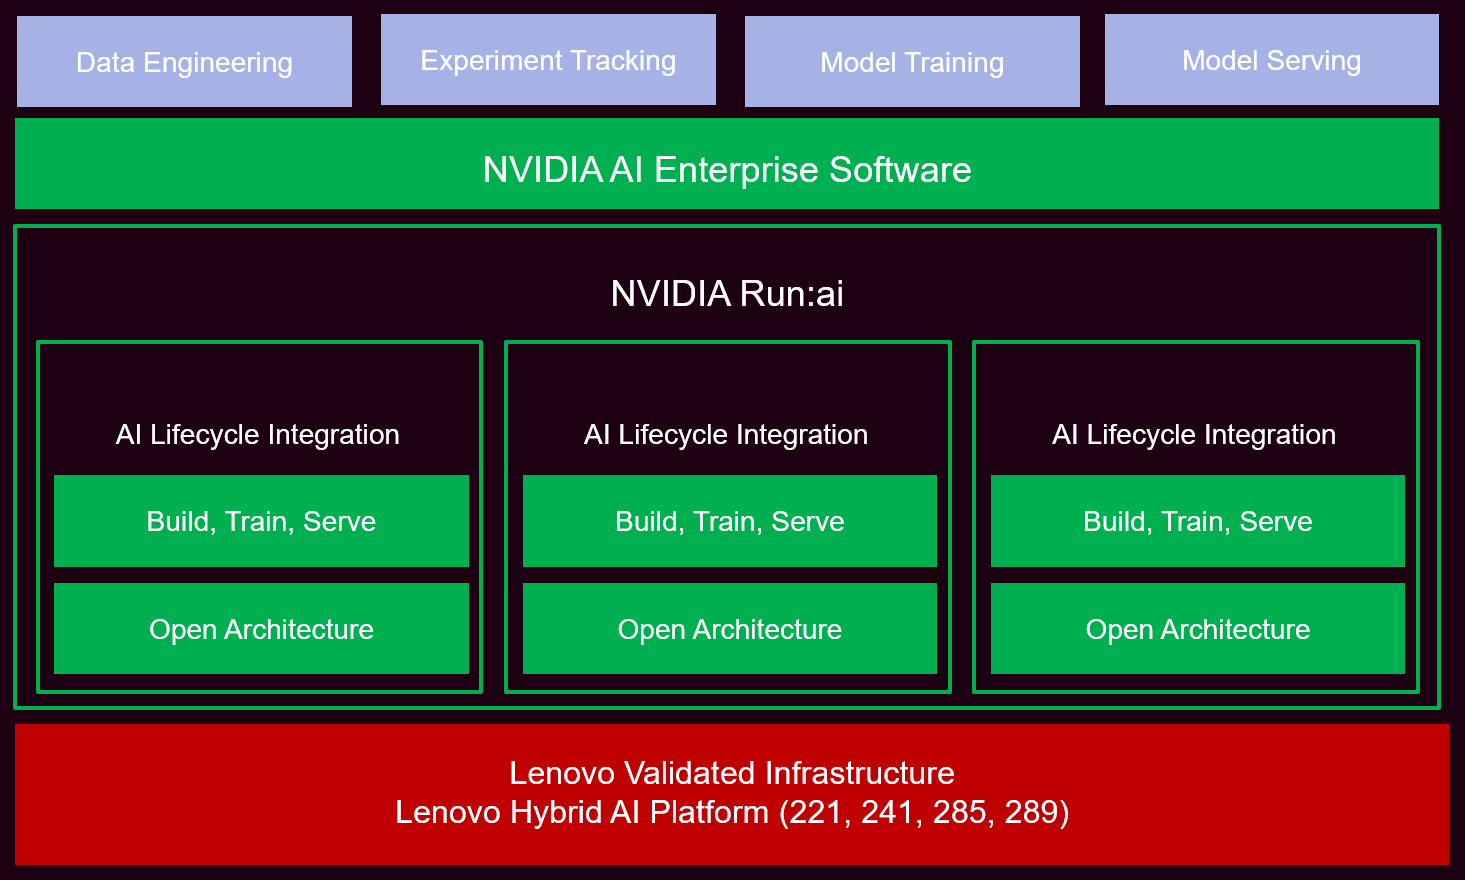
Figure 1. Run:ai software positioning
Run:ai provides two distinct mechanisms for sharing a physical GPU across multiple tenants: fractional GPU sharing, a software-based approach that time-slices a GPU across workloads, and NVIDIA Multi-Instance GPU (MIG) partitioning, a hardware-based approach that physically divides a GPU into isolated instances. Each mechanism has different performance, isolation, and reconfiguration characteristics, and choosing between them requires an understanding of how each behaves under realistic multi-tenant load.
The structure of this paper is as follows:
- Section 2 introduces Run:ai, the Lenovo Hybrid AI Factory, and describes the two GPU-sharing mechanisms under test.
- Section 3 describes the test environment and the measurement methodology used throughout this validation, including our approach to GPU memory saturation and synchronized multi-tenant measurement.
- Section 4 presents multi-tenant benchmark results for GPU fractioning vs MIG partitioning.
- Section 5 covers deployment considerations and metric monitoring options.
- Section 6 summarizes our conclusions and recommendations.
- Section 7 lists the Lenovo Part numbers for NVIDIA Run:ai.
Run:ai and the Lenovo Hybrid AI Factory
The Lenovo Hybrid AI Factory brings together Lenovo's server, storage, and networking infrastructure with a curated software stack for building, training, and deploying AI at scale, spanning on-premises, cloud, and hybrid deployment models. Within the Lenovo Hybrid AI Factory, Run:ai is the layer that turns a pool of Lenovo servers and NVIDIA GPUs into a shared, elastic, multi-tenant AI platform, without requiring individual teams to manage the underlying infrastructure themselves.
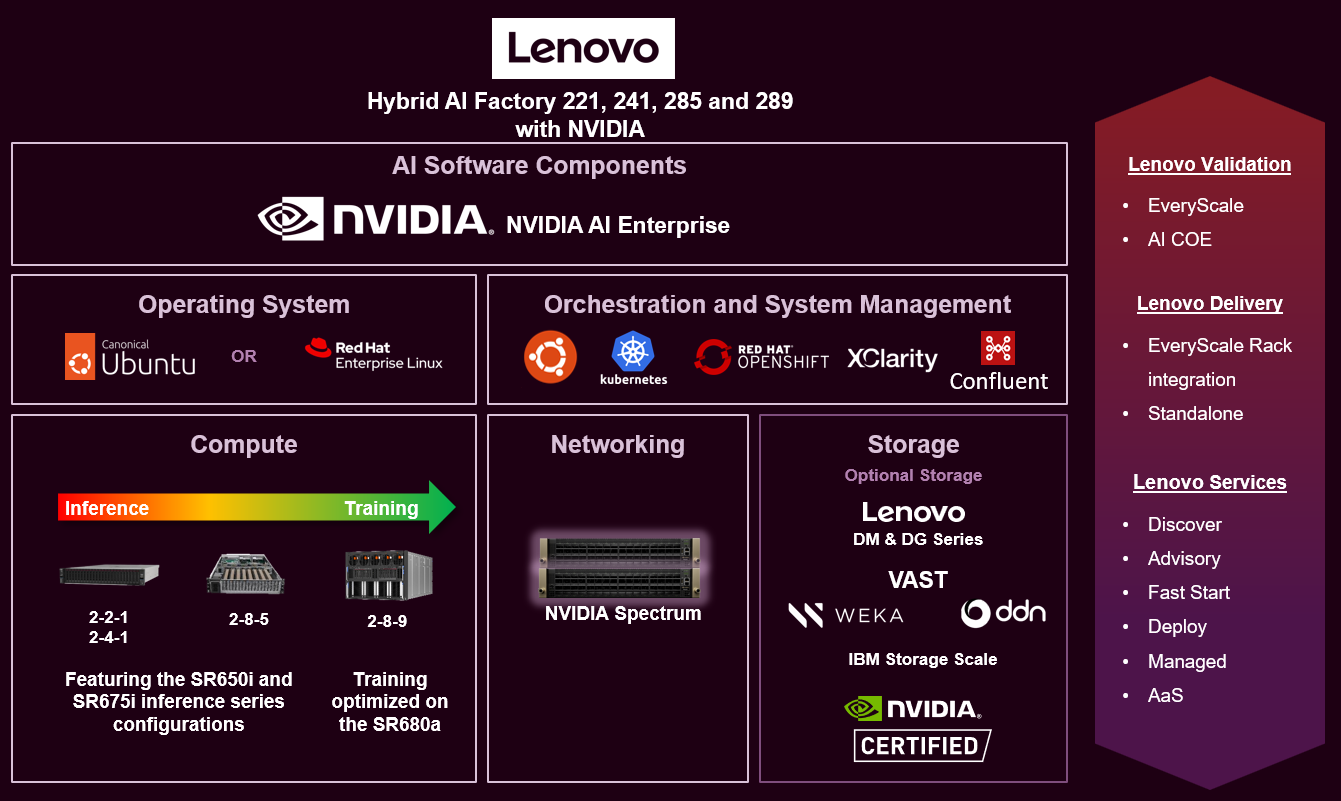
Figure 2. Lenovo Hybrid AI Factory
This validation focuses on Run:ai's two GPU-sharing mechanisms, which are the foundation of that shared, multi-tenant experience:
- Fractional GPU sharing – A software-based approach where Run:ai time-slices a single physical GPU across multiple workloads, each requesting a percentage of the GPU's resources. This is fast to configure and reconfigure, and works well for development, inference, and workloads with bursty or lightweight GPU needs.
- MIG partitioning – A hardware-based approach, available on NVIDIA H100 and other MIG-capable GPUs, that physically divides a single GPU into isolated instances, each with dedicated compute cores and memory. This provides strong performance predictability and hardware-enforced resource isolation between tenants, which is valuable for regulated industries, multi-customer environments, or workloads with strict SLA requirements.
Test Environment and Methodology
The following sections describe the test environment and the measurement methodology used throughout this validation, including our approach to GPU memory saturation and synchronized multi-tenant measurement.
Hardware and Software Environment
This section provides information regarding the hardware used as well as the software deployed to perform benchmark and validation seen throughout this document. The tables below include server specifications, software stack, workload, and the possible MIG profiles that can be deployed on this setup.
Nvidia provides specific MIG profiles for each supported GPU. These profiles partition the VRAM based on the number of instances desired (up to 7) as listed in the following table.
| Profile Name | Number of Instances Available |
|---|---|
| MIG 1g.12gb | 7 |
| MIG 1g.24gb | 4 |
| MIG 2g.24gb | 3 |
| MIG 3g.47gb | 2 |
| MIG 4g.47gb | 1 |
| MIG 7g.94gb | 1 |
More information regarding MIG profiles and architecture can be found at:
https://docs.nvidia.com/datacenter/tesla/mig-user-guide/latest/introduction.html
Benchmark Configuration
The workload deployed for all our benchmarks was a synthetic FP16 matrix-multiplication benchmark. Dense matrix multiplication is the core operation in most deep learning layers, so it gives a clean, compute-bound measure of GPU throughput. It does not reproduce the memory access, data loading, or request patterns of a complete training or inference pipeline.
Each test ran for 300 seconds of sustained GPU computation, which was sufficient to reach steady-state thermal and clock behavior. This approach provides a more realistic measurement of sustained throughput than short-duration benchmark runs. The same benchmark was used across every configuration in this paper, with only the GPU-sharing mechanism and number of concurrent tenants varying between tests. This ensures that the results are directly comparable across configurations.
GPU Memory Saturation
Production AI workloads typically maintain a large fraction of their allocated GPU memory in active use, including model weights, activations, and KV cache. To better reflect these real-world conditions, the benchmark was designed to utilize both GPU compute resources and the majority of the memory allocated to each tenant.
After allocating the timed compute working set, the benchmark queries the amount of GPU memory visible to the workload through the CUDA runtime and allocates an additional inert filler tensor to bring total memory utilization to approximately 85%. This approach increases memory occupancy without altering the size or computational cost of the timed operation itself, allowing throughput comparisons to focus on the effects of the GPU-sharing mechanism under realistic memory utilization conditions.
All results presented in this paper use this VRAM-saturated methodology.
Synchronized Multi-Tenant Measurement
For multi-tenant configurations, each tenant is submitted independently and reaches a running state at a different time. In early testing we found that a tenant which began its measurement window before its neighbors had joined, or continued running after other tenants had already finished, could show meaningfully higher or lower throughput than a tenant that spent its entire measurement window under full contention.
To remove this bias, every multi-tenant test in this paper uses a synchronized-start barrier: each tenant completes its own setup and warmup independently, then signals readiness and waits until every tenant in the test has reached the barrier before any tenant begins its timed 300-second measurement. This ensures that every tenant in a given test experiences the same contention conditions for the full measurement window.
For every configuration presented in this paper, we also confirmed the physical GPU placement of each tenant's workload, using the fractional GPU device identifier or the MIG instance identifier reported to the container.
Multi-Tenant Benchmarks
NVIDIA Run:ai supports multiple tenancy models. For trusted internal users, teams, and departments, Run:ai can provide multi-tenancy within a shared Kubernetes cluster using namespace-based isolation. In this model, isolation boundaries are enforced through Kubernetes mechanisms such as namespaces, RBAC policies, network policies, and resource quotas, while infrastructure resources remain shared across the cluster. More information regarding this can be found in the NVIDIA Run:ai documentation.
The validation presented in this paper follows this trusted-tenant model. Each benchmark workload is treated as a separate tenant representing an independent user, team, or project competing for GPU resources within a shared Kubernetes environment. Although the tenants share the same physical infrastructure, Run:ai schedules and allocates GPU resources independently for each workload, allowing the behavior of fractional GPU sharing and MIG partitioning to be evaluated under realistic multi-user operating conditions.
The validation presented in this paper also explores one of the two workload placement strategies the Run:ai Scheduler can use:
- Bin-pack: The Scheduler places as many workloads as possible on each GPU device to minimize number of GPU devices used. This strategy is used in the fractional GPU sharing benchmarks.
- Spread: The Scheduler spreads workloads across GPU devices within each node to maximize the available resources per workload.
The following sections go over the results of fractional GPU sharing vs. MIG partitioning, as well as some guidance on choosing between the two for customer deployments:
Fractional GPU Sharing: Results
This section goes over the benchmark results of fractional GPU sharing on Run:ai.
All configurations in the above table were confirmed via CLI placement checks to run on a single physical GPU.
Per-tenant throughput degrades steadily and predictably as tenant count increases, from 299.78 TFLOPS with a single dedicated tenant to approximately 38 TFLOPS per tenant when seven tenants share the same GPU. Combined throughput remains close to the single-tenant baseline across the full range tested, remaining between roughly 2% above and 11% below the baseline across all configurations tested. The most efficient configuration tested was two tenants at 50% each, which delivered slightly higher combined throughput than the single-tenant baseline itself.
This behavior is consistent with how Run:ai's fractional scheduler places workloads: tenants are consolidated onto a single physical GPU whenever their combined requested fraction does not exceed 1.0 (bin-packing), and are only spread onto a second GPU once that capacity is exceeded.
More information regarding GPU Fractions and the NVIDIA Run:ai Scheduler can be found at these documentation pages:
Every configuration in the table above, including the seven-tenant case (7 × 0.14 = 0.98), fits within a single GPU's capacity under this policy, which is consistent with all tenants in every row being confirmed on the same physical GPU. Because fractional GPU sharing enforces memory isolation between tenants but not dedicated compute, throughput per tenant is determined primarily by how many other tenants are co-located on the same physical GPU at a given moment, rather than by the fractional mechanism itself.
MIG Partitioning: Results
This section goes over the benchmark results of Multi Instance GPU (MIG) partitioning on Run:ai.
Unlike fractional GPU sharing that utilizes bin-packing, MIG did not consolidate onto a single physical GPU at any instance count tested that was greater than one. MIG instances were distributed across both physical GPUs even when one GPU had capacity for all of them confirmed via placement checks for every configuration above. This is not explained by a difference in node pool configuration since the default node pool used throughout this validation, for both fractional and MIG workloads, is explicitly configured with a bin-pack device placement strategy for GPU resources.
Bin-pack and spread describe how the Scheduler distributes workloads across a GPU that is being shared, so this setting governs fractional GPU placement directly. Run:ai treats each MIG instance as an independent GPU rather than a device being shared, so there is no shared device for the Scheduler to pack multiple workloads onto. Each MIG instance is allocated to a workload as a single unit with device-level selection handled by the underlying NVIDIA Kubernetes device plugin rather than Run:ai’s placement strategy. Because of this, combined throughput in Table 4 reflects the total physical GPU capacity in use for each configuration, which varies from row to row, and is not directly comparable to the fractional results in Table 3, except at a single instance.
Per-instance throughput is highly consistent among tenants sharing the same physical GPU, typically within 1%, which we attribute to MIG's hardware-level compute and memory isolation. Where a configuration splits unevenly across the two GPUs, throughput differs between the two groups roughly in proportion to how many instances are contending on each: at three instances, for example, the single instance on the less-populated GPU reached 191.30 TFLOPS, while the two instances sharing the other GPU averaged 142.58 TFLOPS.
Running a full, undivided GPU as a single MIG instance achieved 331.22 TFLOPS, approximately 10% higher than fractional sharing's single-tenant result of 299.78 TFLOPS under the same VRAM-saturated methodology, even though both configurations involve a single, unshared tenant with no contention. We attribute this difference to how each mechanism enforces tenant isolation: fractional GPU sharing enforces its memory and process limits via a software interception layer running inside the workload's container, whereas MIG provides direct, hardware-partitioned access to an isolated slice of the GPU with no equivalent software layer in the data path. This suggests that MIG carries little to no overhead from memory-subsystem enforcement, while fractional sharing's enforcement mechanism introduces a measurable, consistent cost even for a single, unshared tenant.
Because MIG's placement policy differs fundamentally from fractional sharing's at every instance count tested here, a fair comparison between the two mechanisms requires matching not just tenant count but total physical GPU capacity in use. The following section Controlled Comparison at Matched Scale presents such a comparison.
More information about NVIDIA MIG can be found at NVIDIA MIG User Guide.
Controlled Comparison at Matched Scale
To enable a direct comparison between fractional GPU sharing and MIG partitioning, both mechanisms were evaluated using the maximum supported density for MIG partitioning on the test system. Across the two physical GPUs, this corresponds to 14 tenants: fourteen 0.14-GPU fractional allocations for fractional sharing, and fourteen instances of the 1g.12gb MIG profile (seven per GPU) for MIG partitioning. Both scenarios used the synchronized-start methodology described in the Synchronized Multi-Tenant Measurement section, ensuring that submission-order effects did not influence the results.
At matched scale, with submission-order bias eliminated, fractional GPU sharing and MIG partitioning deliver essentially identical aggregate throughput, a combined difference of less than 1%.
Both tests in the above table also independently reproduce a consistent throughput advantage of roughly 8-9% for the same physical GPU (labelled GPU 1 throughout this validation), regardless of which sharing mechanism is in use. We attribute this to a fixed hardware or NUMA/PCIe topology difference between the two GPUs in this server, rather than to either GPU-sharing mechanism.
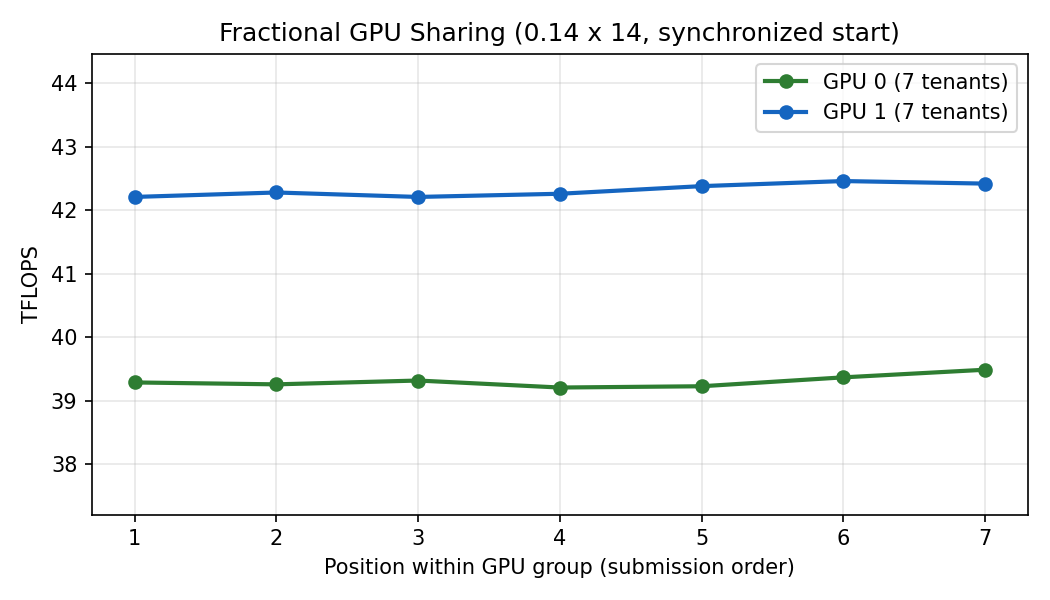
Figure 3. Per-tenant TFLOPS for fractional GPU sharing at 0.14 fraction x 14 tenants (synchronized start), split by physical GPU. Each GPU's 7 tenants cluster tightly, confirming a clean 7-and-7 split with no submission-order bias.
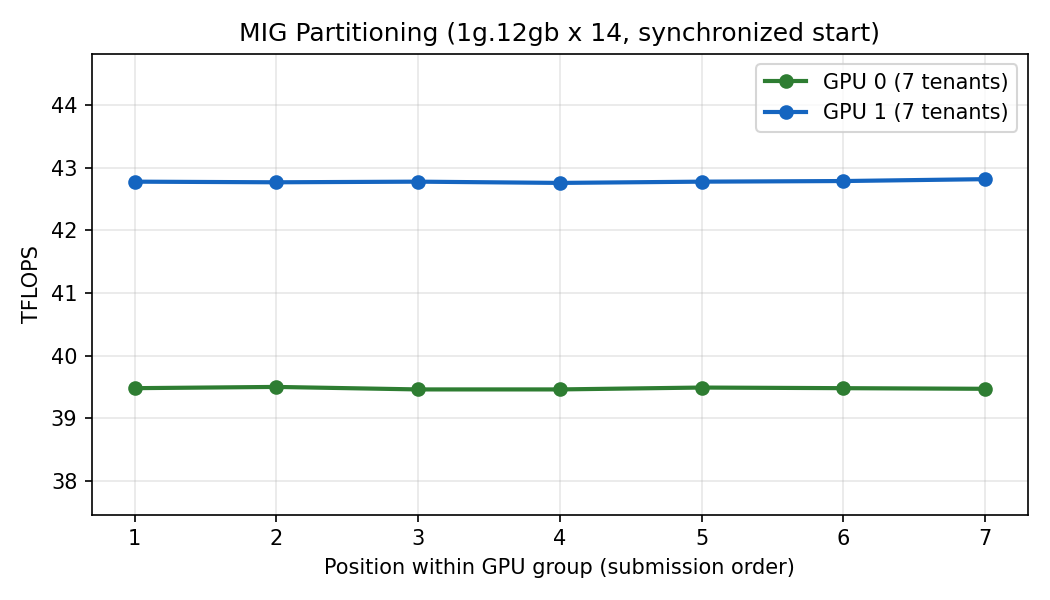
Figure 4. Per-tenant TFLOPS for MIG partitioning at 1g.12gb x 14 instances (synchronized start), split by physical GPU. The same clean 7-and-7 split and tight per-tenant consistency seen in the fractional test above.
Choosing Between Fractional Sharing and MIG
The validation shows that both GPU-sharing approaches are strong choices, and, as the controlled comparison in the Controlled Comparison at Matched Scale section demonstrates, the choice between them is not primarily a question of raw throughput: at matched scale, both mechanisms deliver essentially the same aggregate performance. The right choice instead depends on isolation requirements, reconfiguration needs, and organizational workflow. Run:ai supports both on the same Lenovo infrastructure, allowing customers to mix approaches across different projects, departments, or GPU pools as needed.
Because MIG partitions the GPU into a fixed number of hardware slices, the way tenants are grouped can affect how much of the GPU's total capacity is actually used and, as shown in the MIG Partitioning: Results section, does not necessarily consolidate onto as few physical GPUs as possible. Customers planning MIG deployments should choose partition sizes that align with expected tenant counts and validate actual instance placement, rather than assuming a particular consolidation behavior.
Deployment Considerations
Run:ai integrates cleanly into a standard Kubernetes environment running on Lenovo servers, with GPU Operator handling driver and device-plugin management. A few practical considerations are worth planning for as part of a production rollout:
- MIG partition changes are applied at the node level and are best scheduled during a maintenance window, since changing a GPU's partition layout affects all workloads currently scheduled on that GPU. In this validation, some transitions between partition geometries require a node reboot to complete cleanly. Maintenance windows for MIG reconfiguration should be planned with this in mind.
- For teams building custom ML pipelines, Run:ai works well alongside standalone MLOps tooling such as MLflow. Where experiment history needs to persist across workspaces and over time, deploying tracking and experiment-management infrastructure independently of individual workspaces is the more durable approach.
- On multi-GPU servers, Run:ai's project and quota configuration should be reviewed to ensure workloads are distributed across all available GPUs according to the customer's utilization and isolation goals, particularly given that fractional sharing and MIG partitioning distribute tenants across physical GPUs differently, as shown in the Multi-Tenant Benchmarks section.
- NVIDIA GPU Operator and Run:ai are both actively developed, so compatibility between the driver, Kubernetes, and Run:ai versions should be validated as part of any deployment plan.
The following sections provide an example of an inference workload that can be started with Run:ai as well as some common telemetry software users could consider deploying with this setup.
Deploying an Inference Workload with Run:ai
Beyond scheduling training and benchmark workloads, Run:ai provides a native, UI-driven path for deploying a model for inference. To demonstrate this, we deployed Qwen2.5-7B-Instruct, served by vLLM, as a Run:ai Inference workload on this same cluster, using the fractional GPU sharing mechanism characterized throughout this paper. The process requires no custom container image, no Kubernetes manifests, and no manual model packaging: a model is selected directly from Hugging Face, resource and storage settings are filled in through a short sequence of form-based configuration screens, and the result is a live, query-able inference endpoint.
Creating the workload begins with selecting an inference server, as shown in the figure below. We selected vLLM, and gave the workload a name.
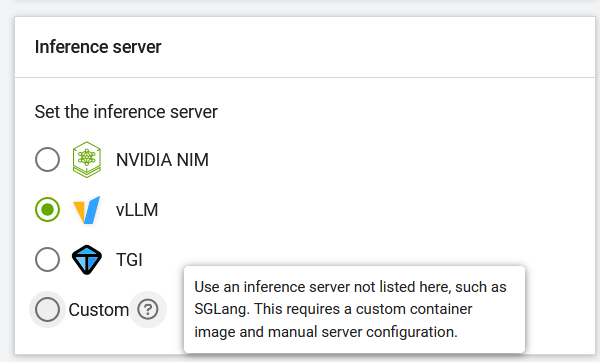
Figure 5. Selecting the inference server. Options include NVIDIA NIM, vLLM, TGI, or custom containers
The model itself is chosen from a live, searchable list of Hugging Face models, with no separate download, conversion, or upload step required beforehand; Run:ai handles retrieving the model when the workload starts. The same screen sets whether the resulting endpoint is reachable only within the cluster or exposed externally, as shown in the figure below.
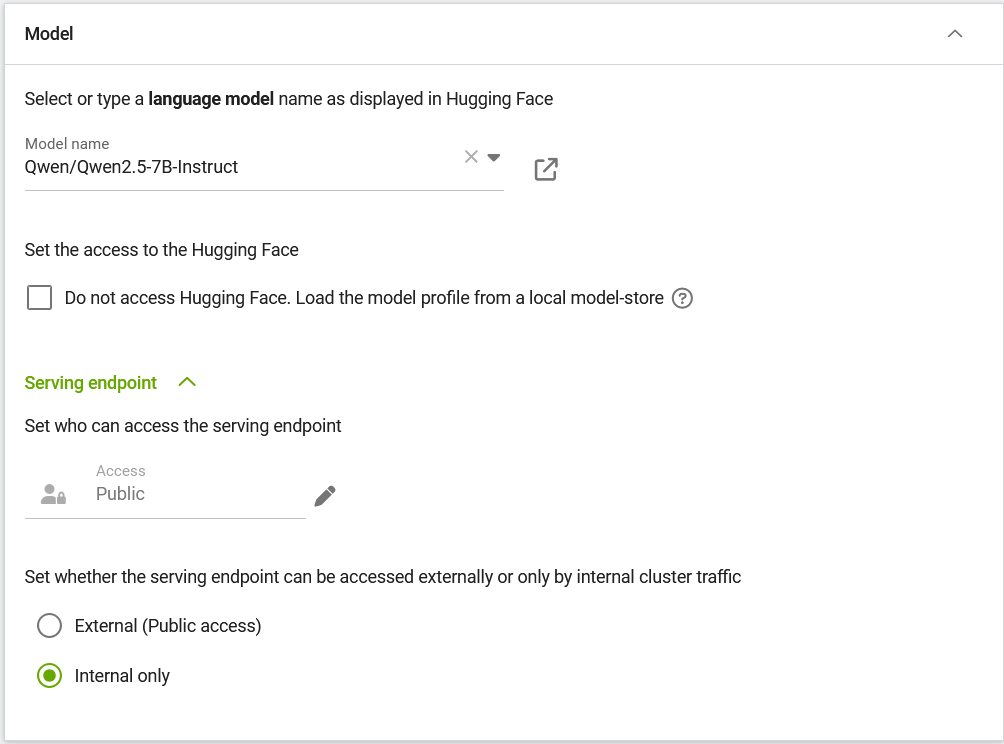
Figure 6. Selecting a Hugging Face model and configuring inference endpoint access when creating a Run:ai Inference workload
If a local model repository is preferred, it can be pulled in via the Model store section as shown in the figure below.
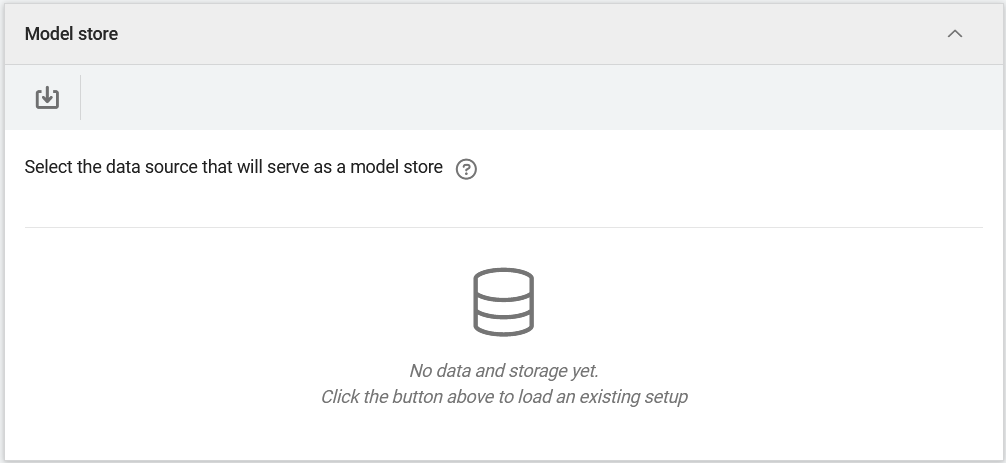
Figure 7. Connect local model repository if desired
Compute resources for the workload are configured the same way as any other Run:ai workload, using the same fractional GPU sharing mechanism validated in the Multi-Tenant Benchmarks section. Here, the 7-billion-parameter model was assigned a single GPU device at a 25% memory fraction, comfortably sized for the model's footprint while leaving the remainder of that physical GPU available to other tenants. Replica count and autoscaling behavior are set on the same screen, giving the workload a defined minimum and maximum number of serving replicas.
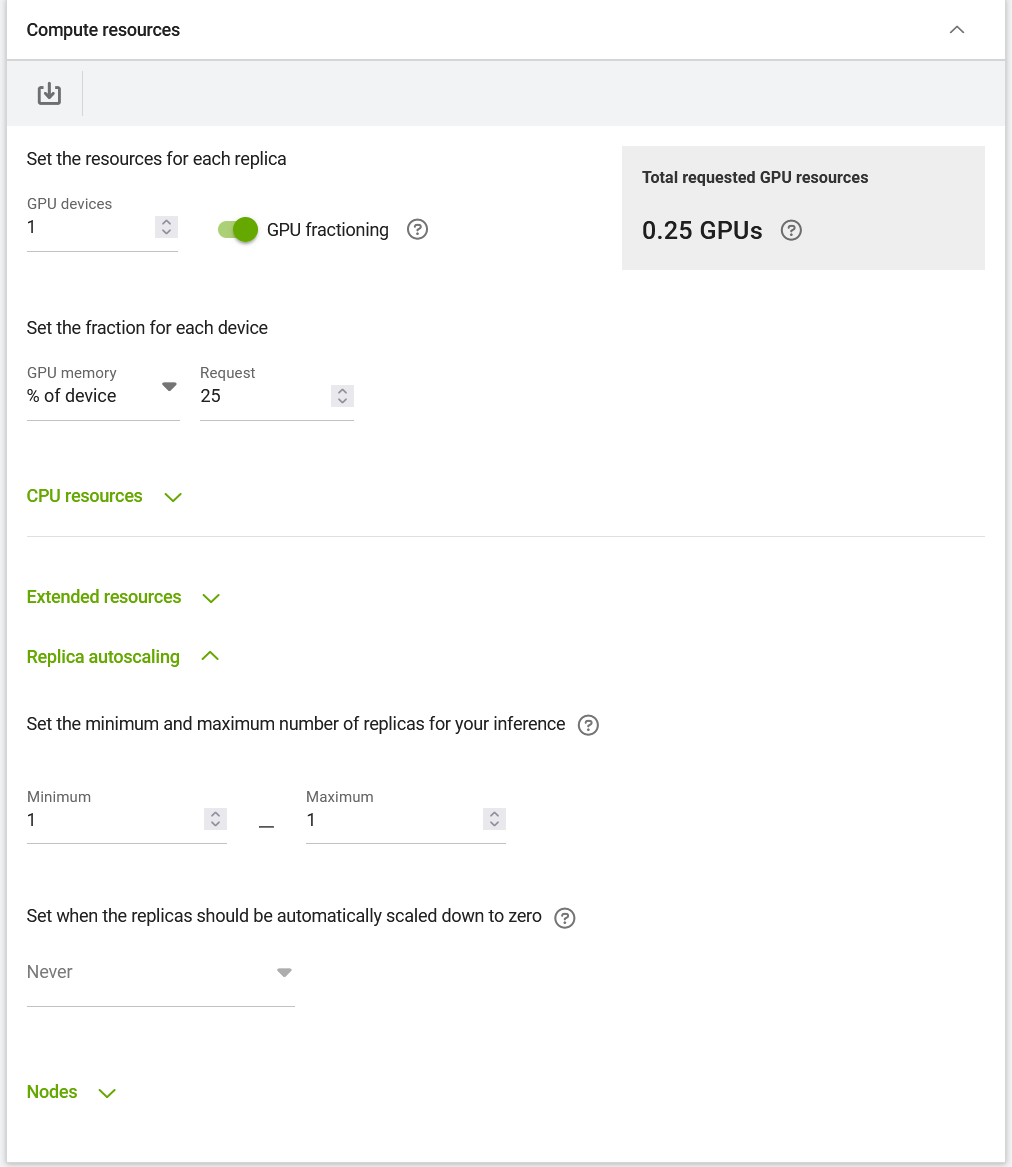
Figure 8. Compute resource configuration for the inference workload, showing GPU fractioning set to 25% of a single device and replica autoscaling bounds
The final step attaches persistent storage for the downloaded model weights, provisioned here as a new Kubernetes Persistent Volume Claim backed by the same NFS storage class used elsewhere in this deployment. Once submitted, Run:ai schedules the workload onto the fractional GPU slice, downloads the model, and starts the vLLM server; the workload's Connections panel then exposes a serving endpoint that any OpenAI API-compatible client can query directly.
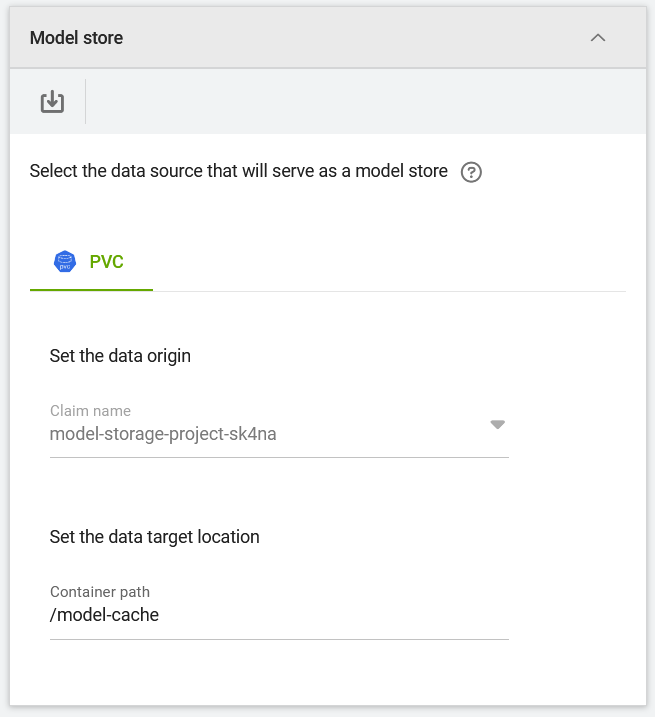
Figure 9. Attaching a persistent volume claim as the model store for the inference workload
For customers, the practical result is that a team can go from choosing a model to a running, shareable inference endpoint without writing deployment YAML, building a container image, or coordinating with a platform team for GPU allocation, using the same few configuration screens regardless of whether the underlying workload is training, benchmarking, or serving.
Once running, the workload’s endpoint is usable by any OpenAI API-compatible client. As an example, a lightweight Open WebUI deployment was pointed at the workload’s internal serving address to provide a chat interface for interactive testing. The same endpoint could also be called directly from an application, a notebook, or a command-line client. The figure below shows a live exchange with the deployed model, confirming the full path from model selection to a working and query-able endpoint.
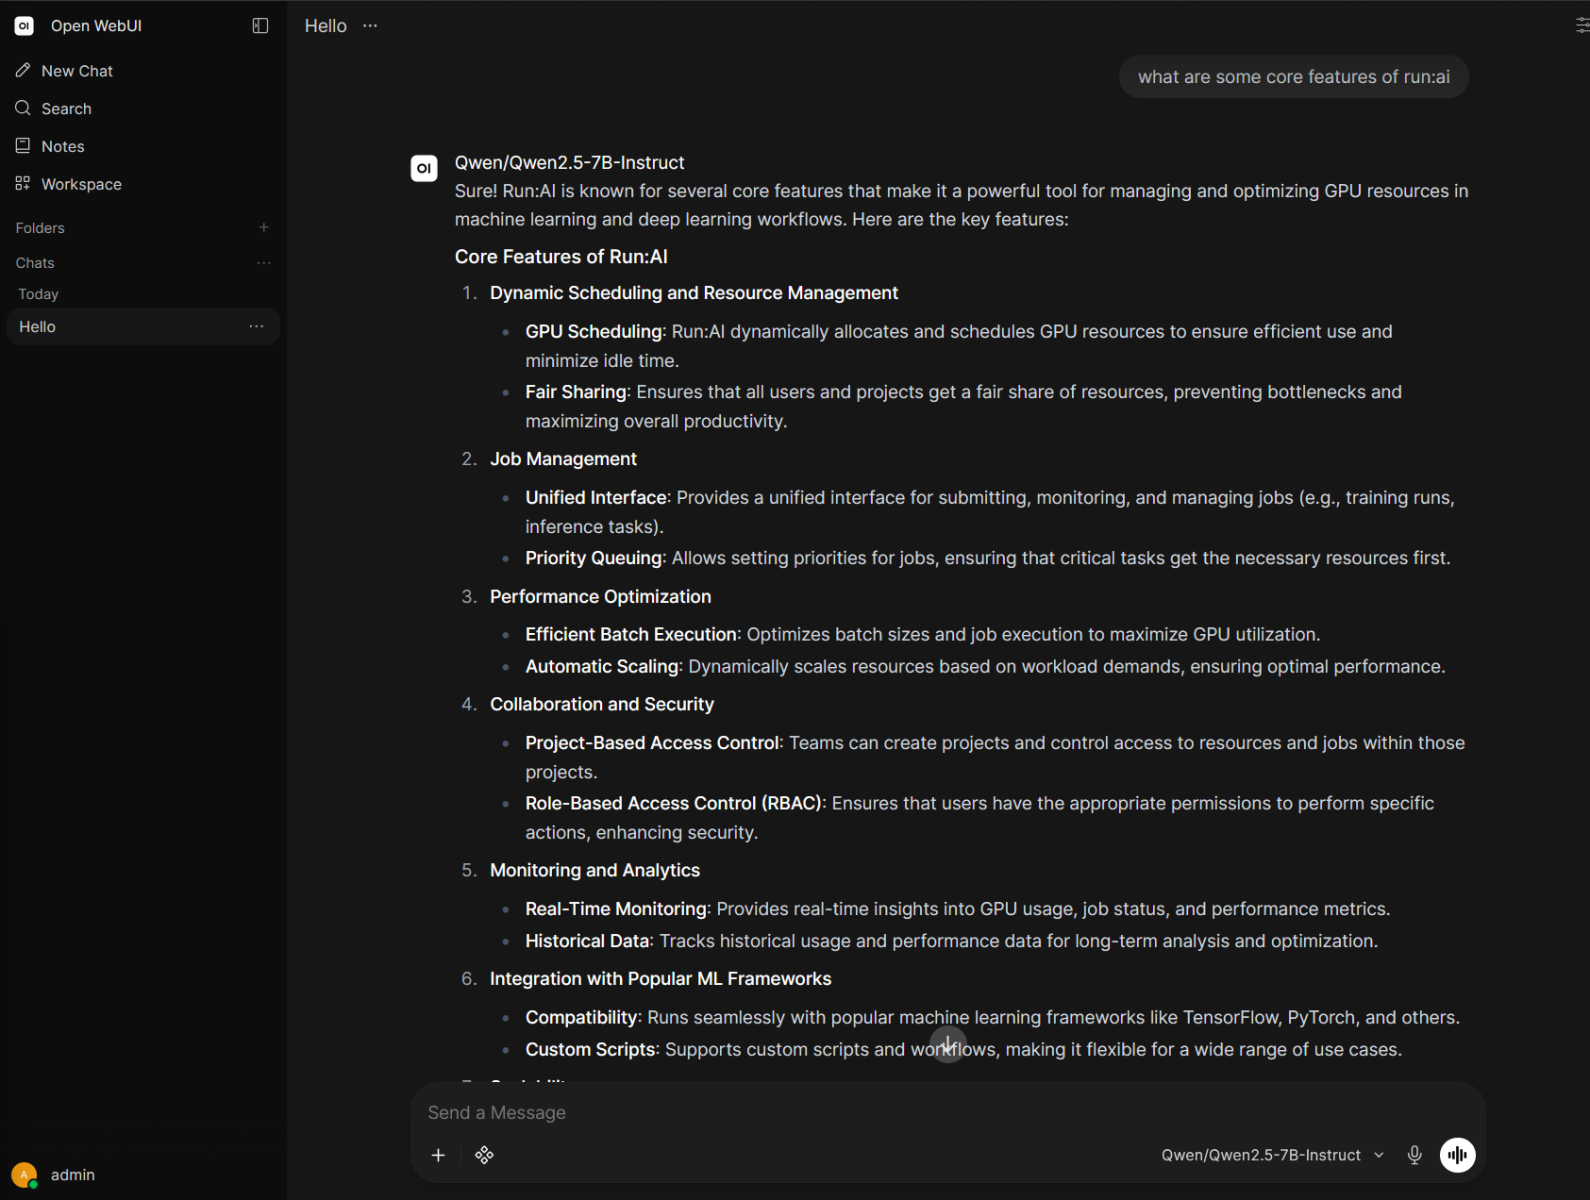
Figure 10. A working chat exchange with the deployed Qwen2.5-7B-Instruct model, served through the Run:ai inference workload and accessed here via Open WebUI
Experiment Tracking with MLflow
Data science teams need visibility into how their workloads are performing, not just whether GPU capacity is available. Throughout this validation, MLflow was deployed alongside Run:ai as an experiment tracking layer, giving each workload a place to log metrics, parameters, and results independent of the underlying GPU allocation.
Run:ai also provides native integration for connecting a workspace directly to MLflow. When defining a workspace, users can add MLflow as a Tool alongside other connections such as Jupyter, specifying a connection type, container port, and access policy; Run:ai then auto-generates an externally reachable URL for that tool, with no additional networking configuration required. Every active connection for a running workload, including its port and full URL, is visible from the Workloads page, giving platform teams a quick way to confirm how a given workspace and its tools are reachable.
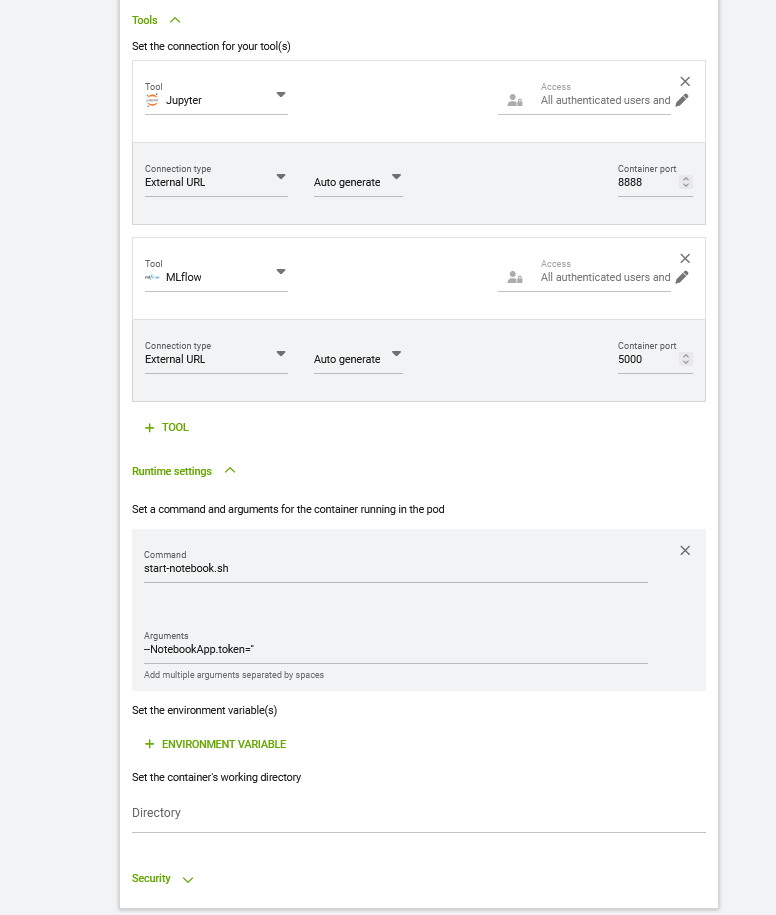
Figure 11. Configuring an MLflow tool connection for a Run:ai workspace, alongside a Jupyter connection, with auto-generated external URLs and container ports
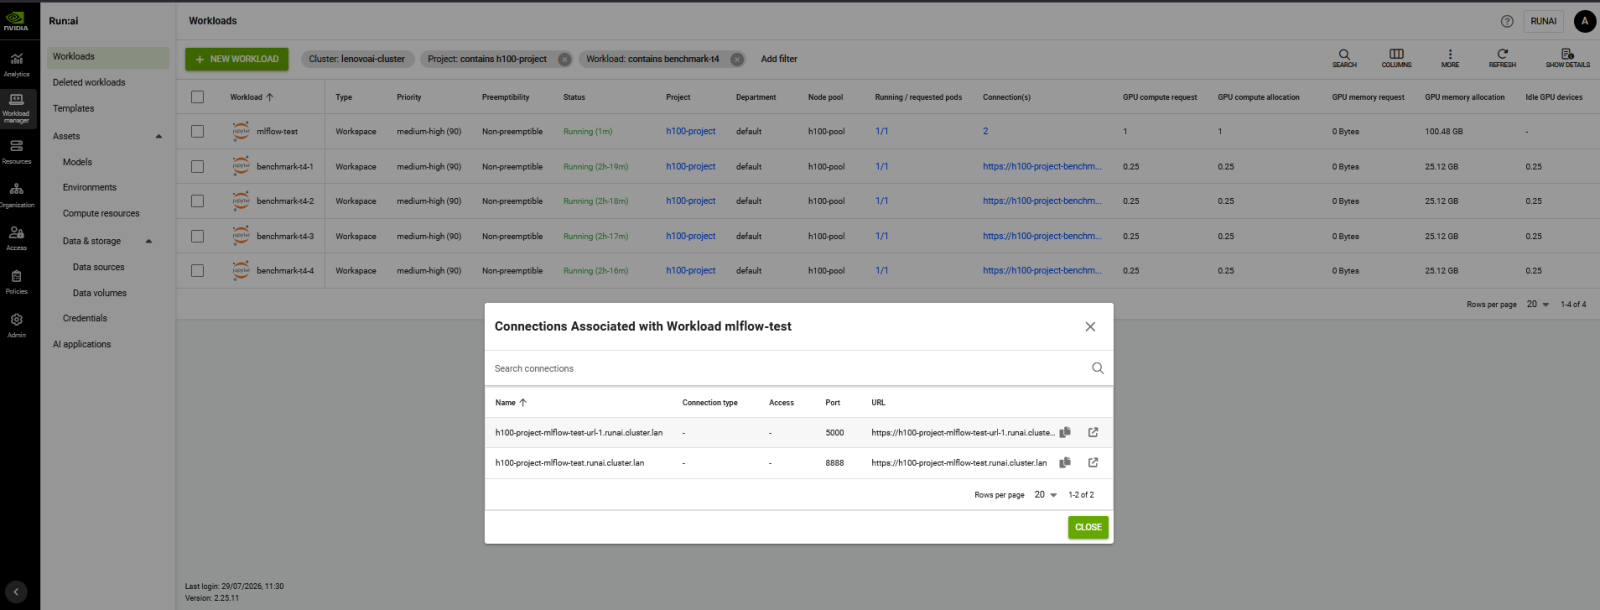
Figure 12. Run:ai Workloads page showing the connections associated with a workspace, including the auto-generated MLflow and Jupyter URLs and ports
This built-in connection is well suited to quick, ad hoc access to a tool running inside a workspace's own pod, such as reaching an MLflow UI during interactive development. Because that connection exists only for the lifetime of the workspace, if persistent experiment history across workloads is required, pairing Run:ai with a standalone MLflow deployment keeps that history available independently of any single workload. This is the approach used for tracking throughout this validation, and it reflects how customers typically operate Run:ai in practice: Run:ai handles scheduling, quota, and GPU allocation, while a separate MLOps tool such as MLflow handles experiment tracking, model versioning, and results comparison. Because Run:ai workspaces are standard Kubernetes pods, they can reach any tracking server on the network, which makes this pairing straightforward to set up and keep running independently of individual workspaces.
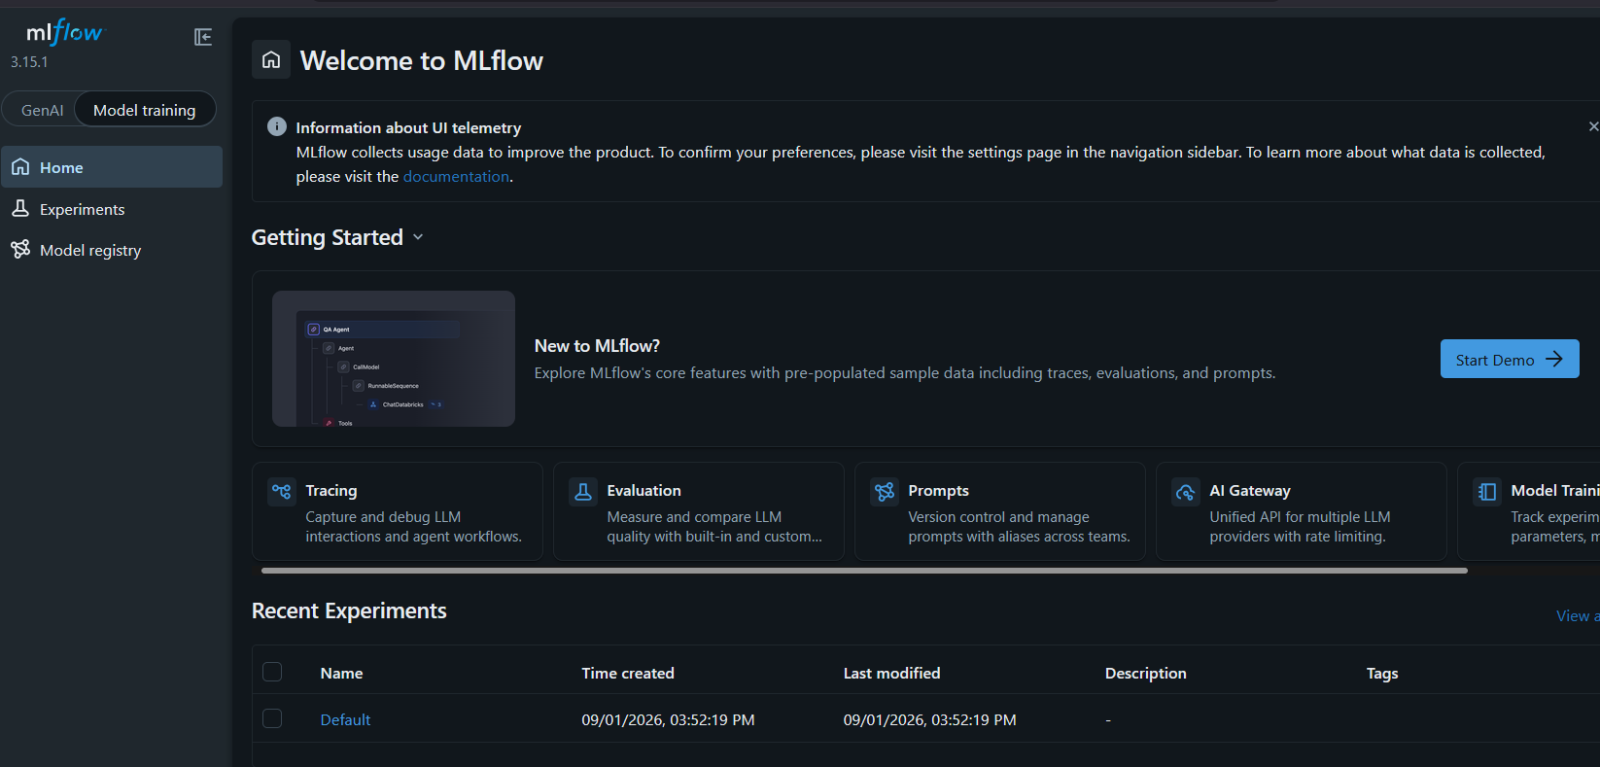
Figure 13. MLflow experiment tracking dashboard, showing tracked experiments and run history
Every benchmark run in this validation logged its throughput, GPU clock speed, power draw, and temperature to MLflow in real time, giving a live view into workload behavior on the GPU. The figure below shows this telemetry for a single tracked run, including the characteristic temperature and clock patterns of a GPU under sustained load.
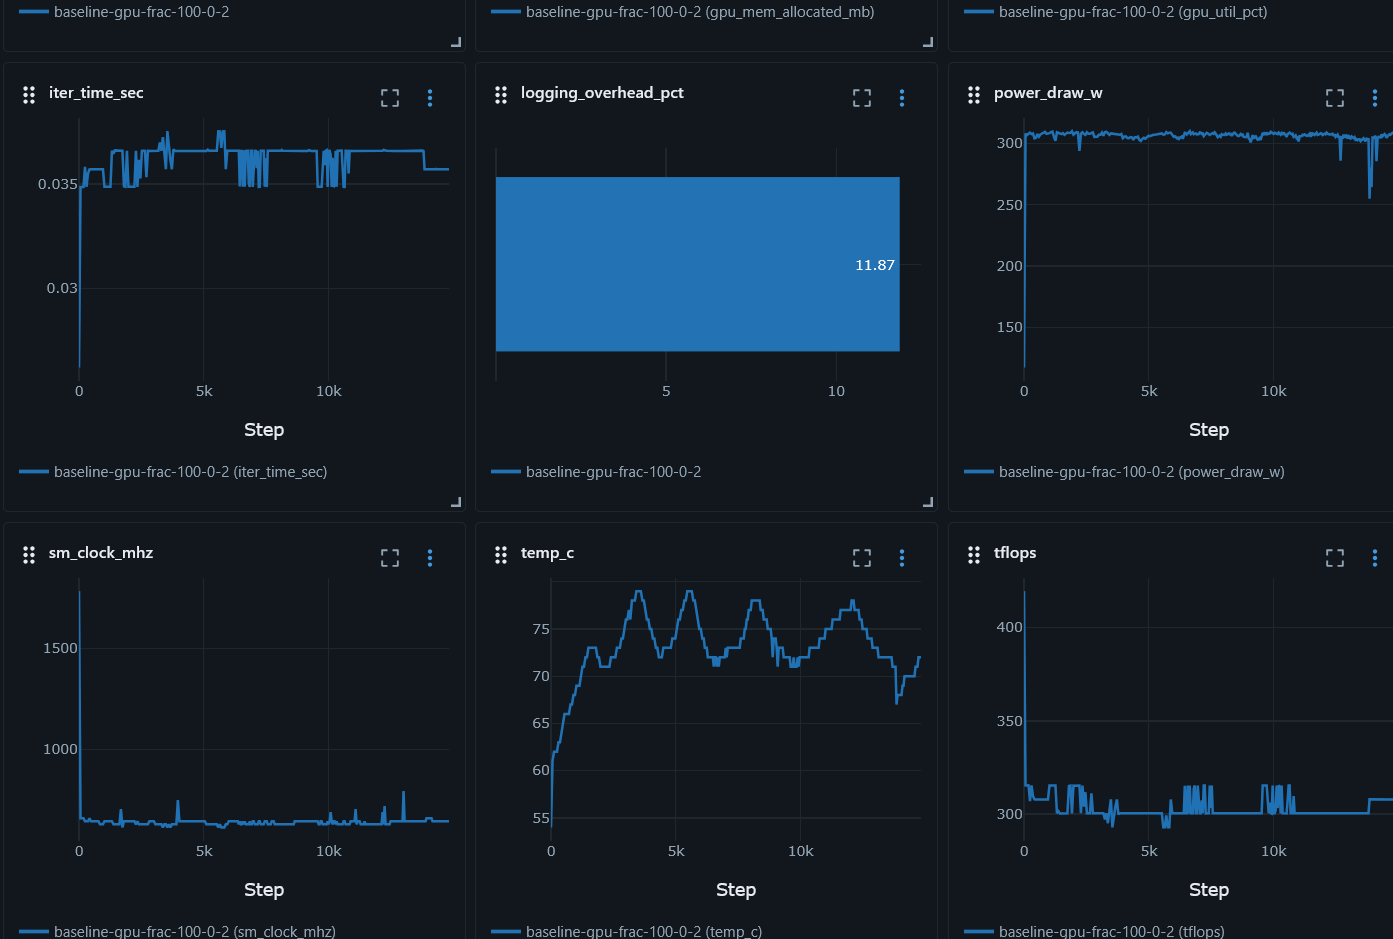
Figure 14. Live GPU telemetry captured in MLflow during a sustained workload, including power draw, clock speed, temperature, and achieved throughput.
This level of visibility is valuable for customers who need to validate GPU utilization and workload health, not just submit jobs and wait for results. Because MLflow runs independently of Run:ai, the same tracking server can be used across fractional GPU and MIG-partitioned workloads alike, giving teams a single, consistent view of experiment history regardless of which GPU-sharing mode a given workload uses.
Monitoring with Prometheus and Grafana
Alongside experiment-level tracking, infrastructure-level GPU monitoring is a core part of a production Run:ai deployment. Run:ai integrates with Prometheus, the industry-standard metrics collection system for Kubernetes, and includes GPU utilization, memory, and scheduling metrics as part of its own metrics endpoints. NVIDIA's DCGM Exporter runs alongside Run:ai to provide detailed, per-GPU hardware telemetry, including utilization, temperature, power draw, and memory usage.
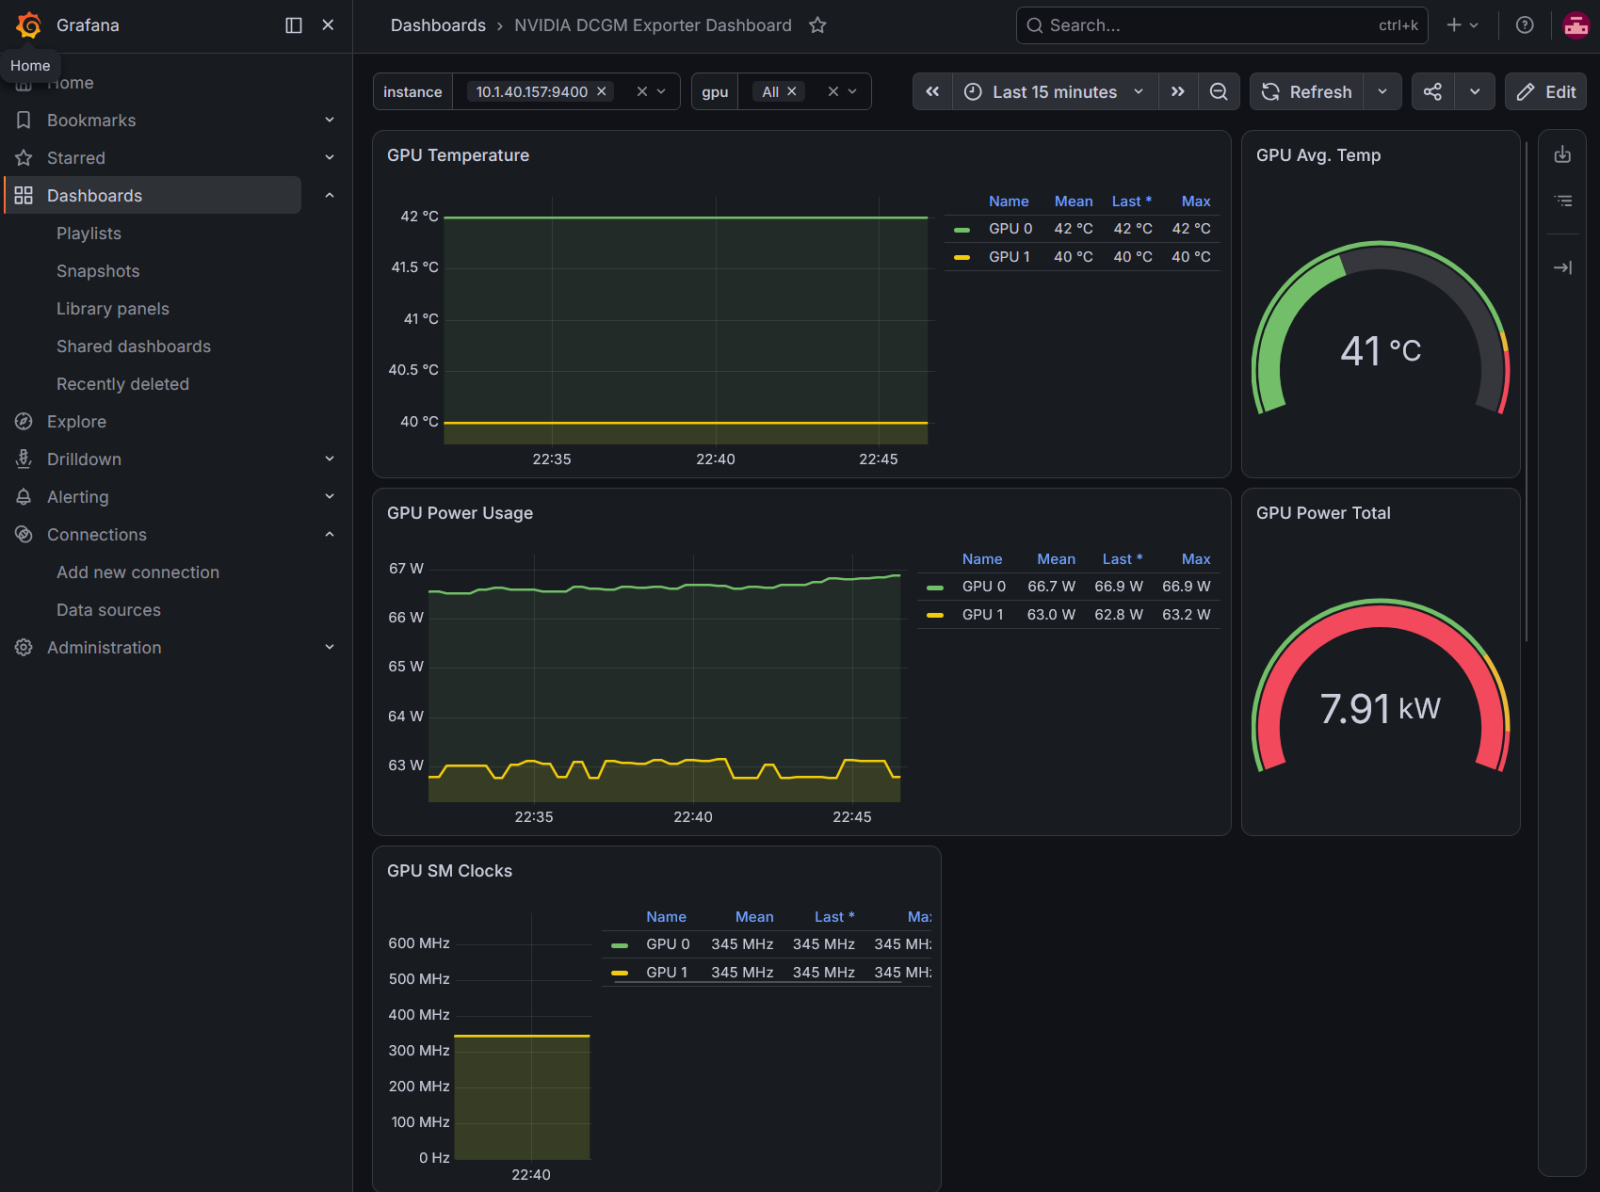
Figure 15. NVIDIA DCGM Exporter dashboard in Grafana, showing per-GPU temperature and power usage telemetry
Grafana is the standard visualization layer for this data, and Lenovo deploys it as part of the broader Hybrid AI Factory monitoring stack. Grafana dashboards built on Run:ai and DCGM metrics provide platform teams with a real-time, fleet-wide view of GPU health and utilization across the cluster. This visibility supports capacity planning, identification of underutilized resources, and verification that fractional GPU and MIG-based workloads are operating as expected at the infrastructure level.
Typical dashboards and monitoring views include:
- Cluster-wide GPU utilization, allowing platform teams to quickly identify GPUs that are busy, idle, or overcommitted.
- Hardware health signals such as temperature and power draw, surfaced from NVIDIA DCGM, to catch thermal or power issues before they affect workload performance.
- Alerting on GPU-level and scheduler-level conditions, integrated with the customer's existing Prometheus Alertmanager configuration.
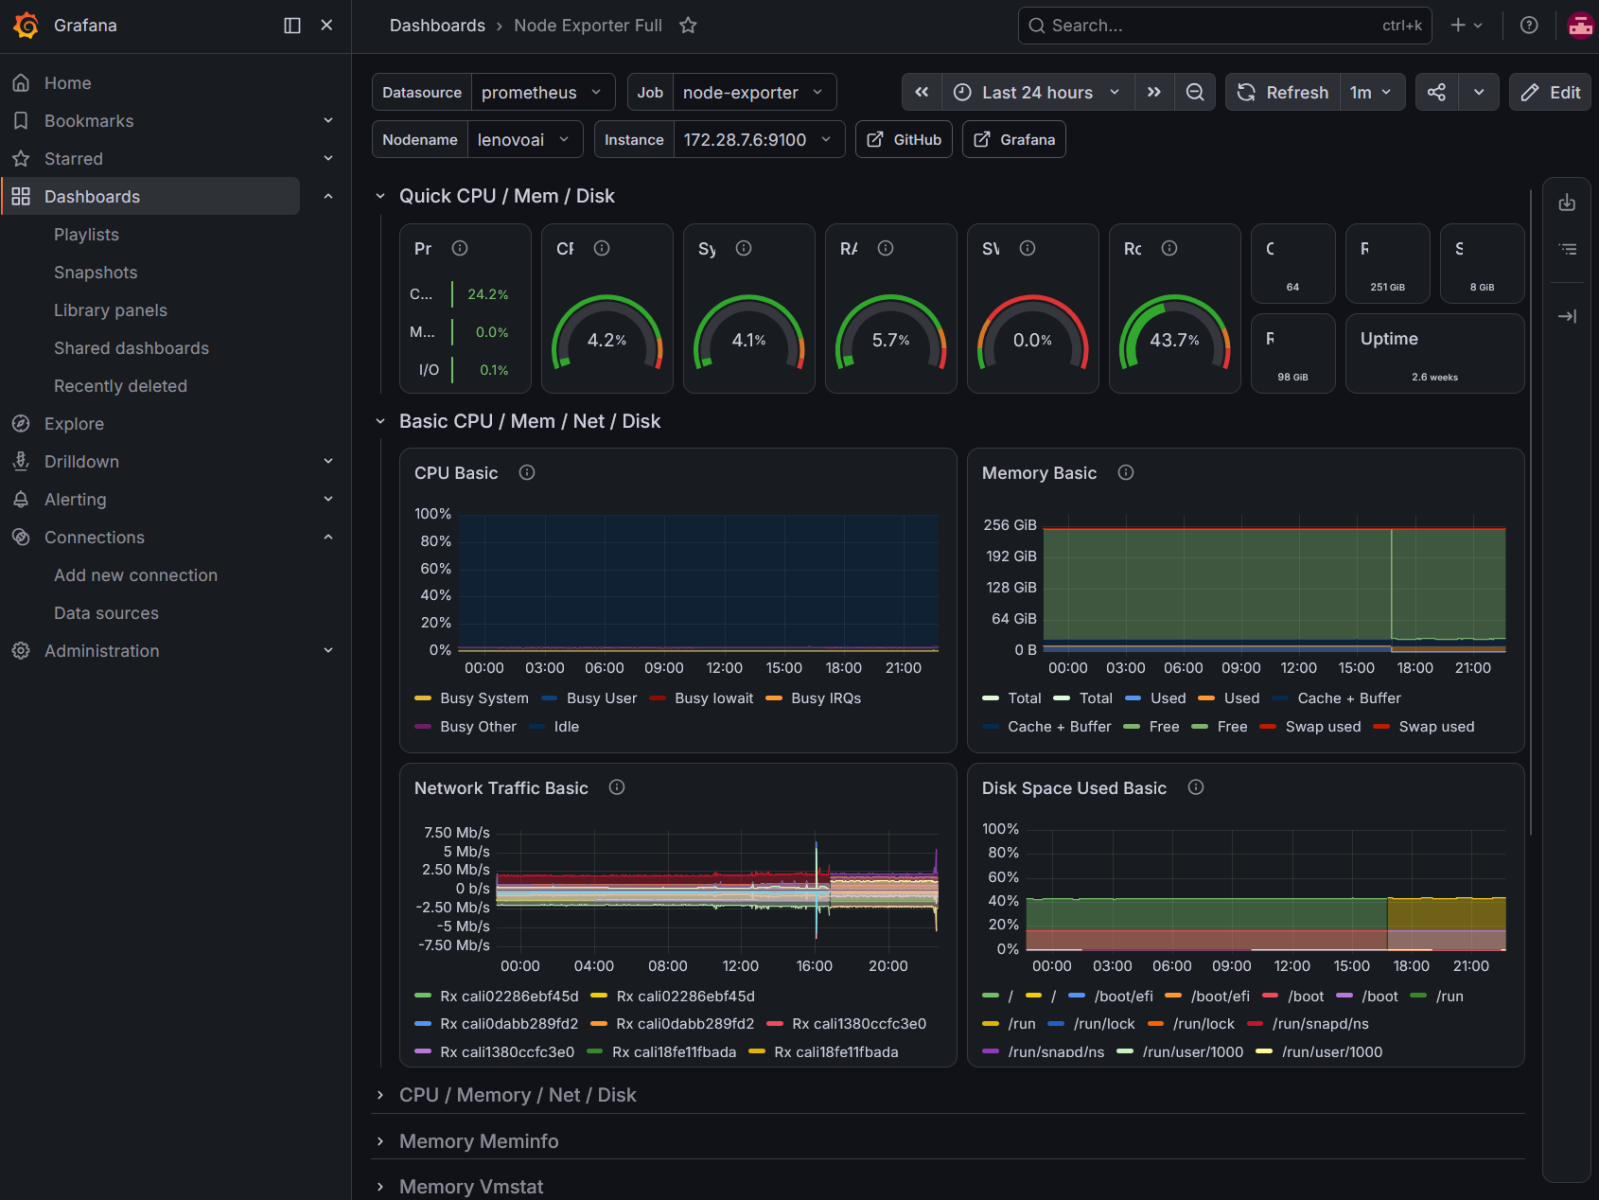
Figure 16. Node Exporter Full dashboard in Grafana, showing cluster-wide CPU, memory, network, and disk utilization for a node in the cluster.
Together, MLflow and the Prometheus and Grafana stack give customers visibility at both the workload level and the infrastructure level: MLflow answers "how is my experiment performing”, while Grafana answers "how is my GPU fleet performing". Both are included as part of a standard Run:ai deployment on the Lenovo Hybrid AI Factory.
Monitoring Workload Metrics with Run:ai
In addition to the cluster-wide Grafana dashboards described in the previous section, Monitoring with Prometheus and Grafana, Run:ai exposes live, per-workload metrics directly in the Workloads page, with no separate dashboard to build or maintain. Selecting a running workload and opening its Metrics tab gives two views: Resource utilization, common to every workload type, and a workload-type-specific view, in this case Inference, surfacing metrics specific to a serving workload. To generate a representative load for this view, the Qwen2.5-7B-Instruct inference workload from the Deploying an Inference Workload with Run:ai section was driven with a sustained burst of concurrent chat completion requests.
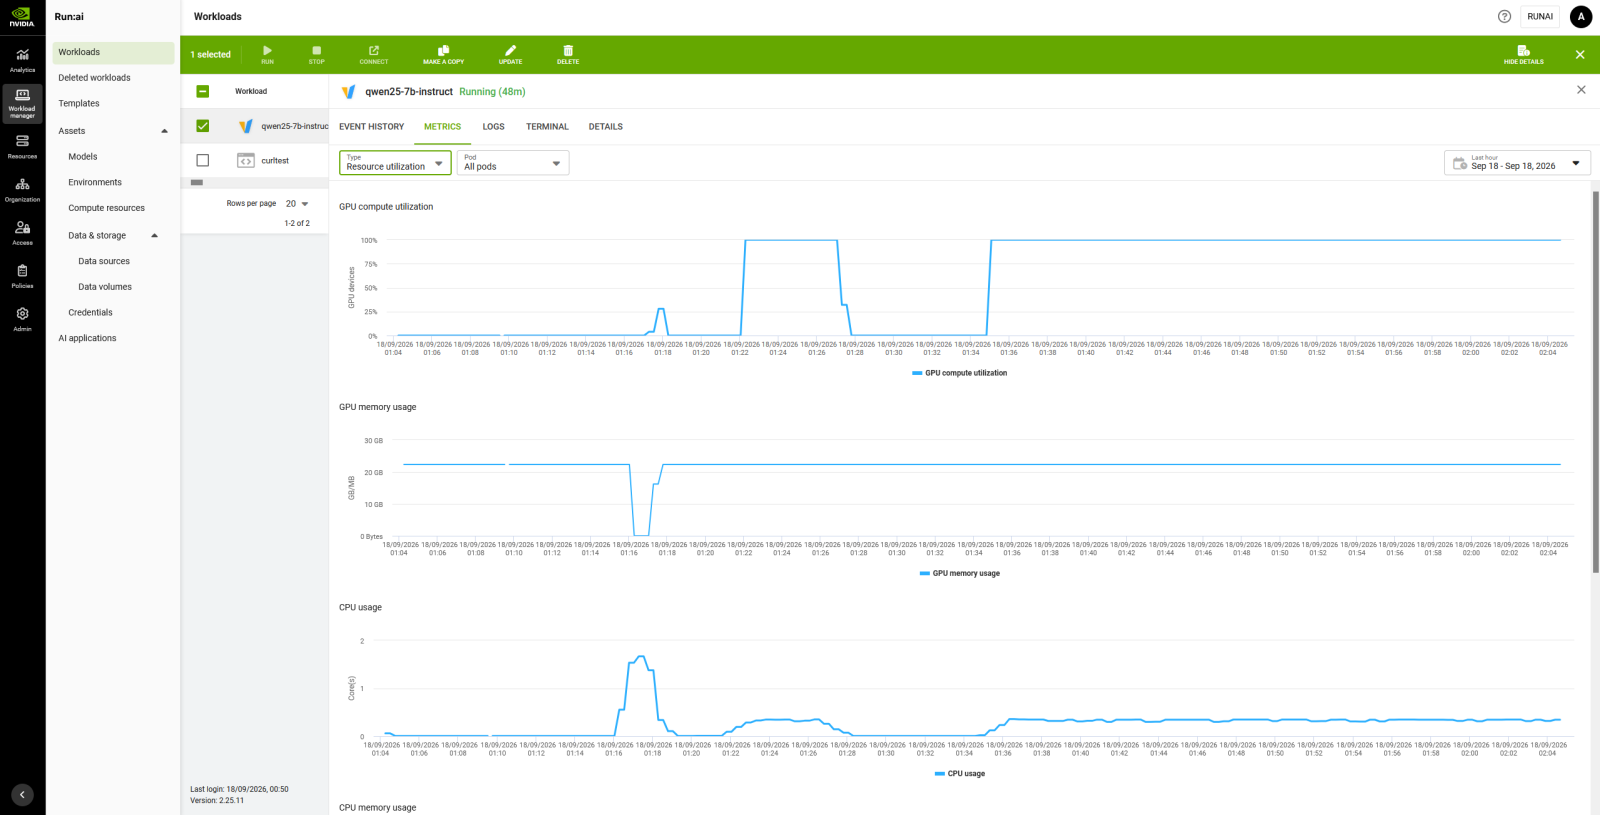
Figure 17. Run:ai's Resource utilization view for the Qwen2.5-7B-Instruct inference workload, showing GPU compute utilization, GPU memory usage, and CPU usage during a period of sustained request load.
GPU compute utilization climbs to 100% during each period of active load and returns to zero between them, while GPU memory usage remains essentially flat at approximately 22 GB throughout, consistent with the 25% GPU fraction requested for this workload holding the model resident in memory regardless of whether it is actively serving requests. CPU usage rises and falls in step with the same load periods, reflecting request handling and tokenization work on the host side of the container.
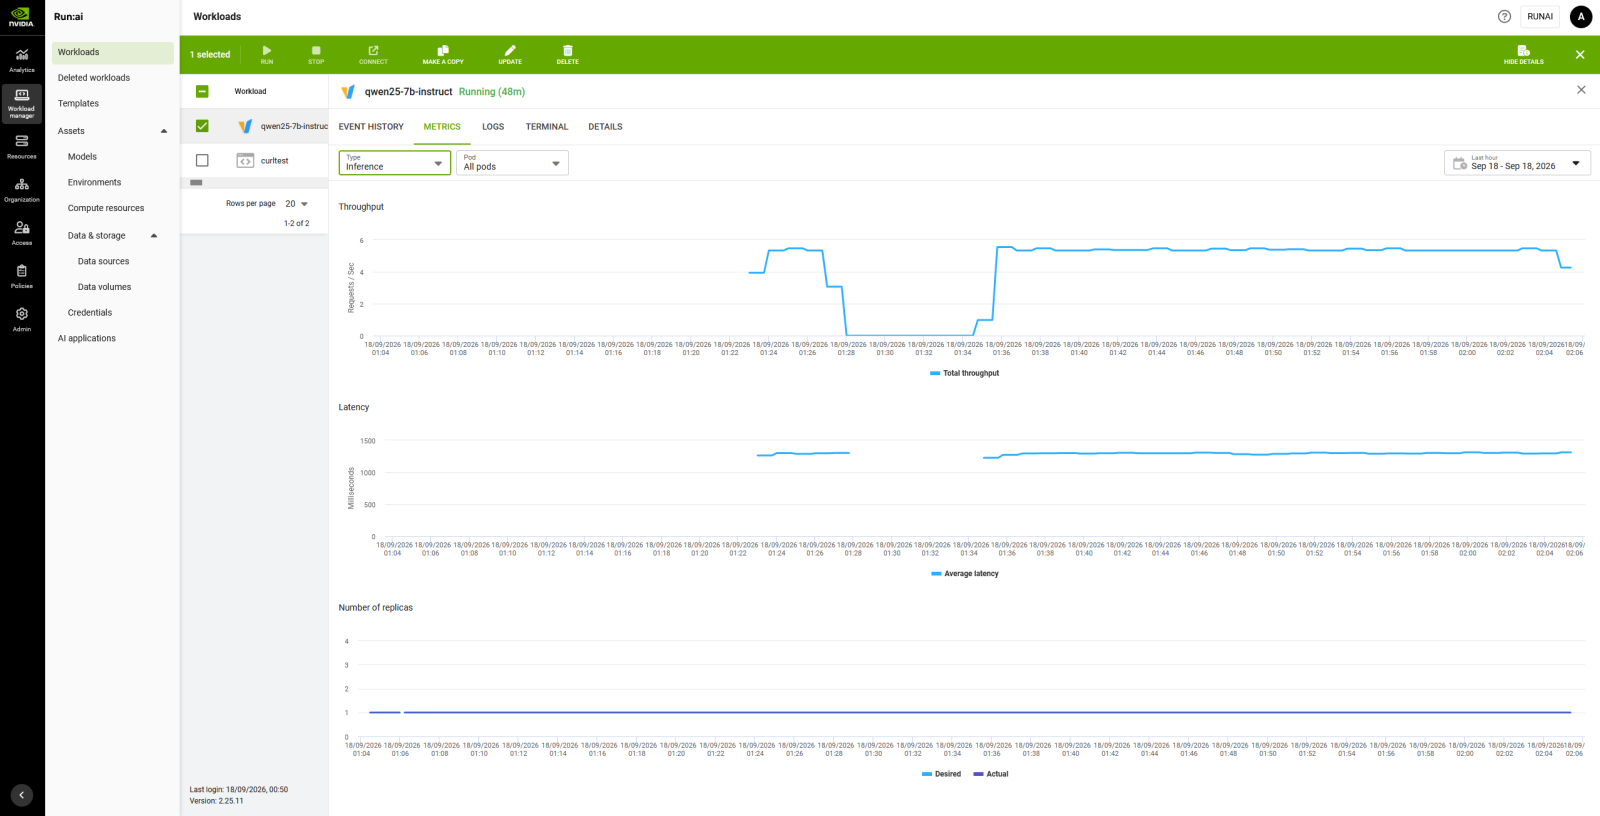
Figure 18. Run:ai's Inference-specific metrics view for the same workload, showing request throughput, average latency, and the desired versus actual replica count.
The Inference view adds metrics specific to a serving workload: total throughput in requests per second, average latency, and the number of active replicas relative to the minimum and maximum values configured for the workload. Throughput rises to approximately 5 to 6 requests per second under sustained concurrent load, with average latency holding steady at just over 1 second per request; both return to their previous state once load stops. The desired and actual replica counts remain equal at 1 throughout, confirming the workload's autoscaling configuration held steady with no scaling events during the test. Together with the Grafana dashboards in the Monitoring with Prometheus and Grafana section, this gives customers both a fleet-wide operational view and immediate, per-workload visibility without additional monitoring infrastructure to set up.
Conclusions and Recommendations
In this paper, we presented a controlled technical validation of Run:ai's two GPU-sharing mechanisms, fractional GPU sharing and MIG partitioning, on Lenovo ThinkSystem SR650 V3 servers with dual NVIDIA H100 NVL GPUs. Using a VRAM-saturated, synchronized-start measurement methodology, we characterized per-tenant and aggregate throughput across a range of tenant counts for both mechanisms.
Our conclusions and recommendations for customers evaluating Run:ai on Lenovo infrastructure are as follows:
- Fractional GPU sharing using the bin-pack methodology delivers predictable, steadily degrading per-tenant throughput as tenant count increases, and reliably consolidates tenants onto a single physical GPU whenever their combined requested fraction fits within one GPU's capacity.
- MIG partitioning delivers highly consistent, hardware-isolated throughput among tenants sharing the same physical GPU, typically within 1% of each other. Unlike fractional sharing, MIG instances were distributed across both physical GPUs at every instance count we tested, including cases where a single GPU had capacity for all instances. Bin-pack and spread are placement strategies for fractional time-sliced sharing of a GPU device. Run:ai treats each MIG instance as its own independent GPU rather than a device being shared, so this setting does not govern how MIG instances are placed. Customers should validate instance placement directly rather than assume MIG instances will be consolidated the way fractional tenants are.
- Under identical VRAM-saturated conditions, MIG's single-instance throughput exceeded fractional sharing's single-tenant throughput by approximately 10%. Further investigation is required to identify the cause of this observation.
- When tested at matched scale, using the same tenant count split identically across the same two physical GPUs with submission-order bias eliminated, fractional GPU sharing and MIG partitioning delivered essentially identical aggregate throughput, within 1% of each other. Customers should not expect a significant raw-throughput advantage from choosing one mechanism over the other; the choice should instead be driven by isolation requirements, reconfiguration frequency, and the granularity at which GPU capacity needs to be divided.
- Fractional GPU sharing is best suited to workloads that benefit from fast, disruption-free reconfiguration and flexible, percentage-based capacity allocation. MIG partitioning is best suited to workloads with strict isolation requirements or predictable, steady resource needs, at the cost of sometimes requiring node-level reconfiguration and, in some cases, a full hardware power cycle, to change partition geometry.
- Run:ai integrates cleanly with standard MLOps tooling such as MLflow and with Prometheus and Grafana for infrastructure monitoring, giving customers visibility at both the workload and fleet level regardless of which GPU-sharing mechanism a given workload uses.
As part of the Lenovo Hybrid AI Factory, Run:ai gives customers a proven, flexible foundation for sharing GPU capacity across many teams and workloads on NVIDIA GPUs. Lenovo and NVIDIA continue to validate and optimize this stack to help customers deploy AI infrastructure with confidence.
Lenovo Part Numbers for Run:ai
References
For more information, see these resources:
- NVIDIA Run:ai Documentation - GPU Fractions:
https://run-ai-docs.nvidia.com/self-hosted/platform-management/runai-scheduler/resource-optimization/fractions - NVIDIA Run:ai Documentation - The NVIDIA Run:ai Scheduler: Concepts and Principles:
https://run-ai-docs.nvidia.com/self-hosted/platform-management/runai-scheduler/scheduling/concepts-and-principles - NVIDIA MIG User Guide:
https://docs.nvidia.com/datacenter/tesla/mig-user-guide/latest/index.html - NVIDIA Run:ai Documentation - Multi-Tenant
https://run-ai-docs.nvidia.com/multi-tenant/getting-started/overview
Author
Abed Islam is a Solutions Architect focused on designing scalable, practical AI platforms for enterprise and edge environments. His work centers on integrating compute, storage, networking, and AI software stacks through close collaboration with technology partners and industry providers. With technical experience in infrastructure architecture and deployment, Abed’s goal is to make advanced AI capabilities accessible, reliable, and production-ready for real-world use.
Trademarks
Lenovo and the Lenovo logo are trademarks or registered trademarks of Lenovo in the United States, other countries, or both. A current list of Lenovo trademarks is available on the Web at https://www.lenovo.com/us/en/legal/copytrade/.
The following terms are trademarks of Lenovo in the United States, other countries, or both:
Lenovo®
ThinkSystem®
The following terms are trademarks of other companies:
NVIDIA® and CUDA® are trademarks of NVIDIA Corporation.
Other company, product, or service names may be trademarks or service marks of others.
Configure and Buy
Please select a locale
Full Change History
Course Detail
Employees Only Content
The content in this document with a is only visible to employees who are logged in. Logon using your Lenovo ITcode and password via Lenovo single-signon (SSO).
The author of the document has determined that this content is classified as Lenovo Internal and should not be normally be made available to people who are not employees or contractors. This includes partners, customers, and competitors. The reasons may vary and you should reach out to the authors of the document for clarification, if needed. Be cautious about sharing this content with others as it may contain sensitive information.
Any visitor to the Lenovo Press web site who is not logged on will not be able to see this employee-only content. This content is excluded from search engine indexes and will not appear in any search results.
For all users, including logged-in employees, this employee-only content does not appear in the PDF version of this document.
This functionality is cookie based. The web site will normally remember your login state between browser sessions, however, if you clear cookies at the end of a session or work in an Incognito/Private browser window, then you will need to log in each time.
If you have any questions about this feature of the Lenovo Press web, please email David Watts at dwatts@lenovo.com.


