

Top
Published
5 Oct 2026Form Number
LP2541PDF size
47 pages, 2.2 MBSubscribed to LP2541.
Thank you for your feedback.
Table of Contents
Abstract
The increasing power density of CPUs, GPUs, memory, and networking components is creating significant energy, cooling, and power-delivery challenges for modern HPC and AI data centers. This paper introduces the Energy Aware Runtime (EAR), a software solution for monitoring, analytics, energy optimization, and intelligent power capping.
It shows how EAR helps users gain insight into application behavior, identify inefficiencies, improve performance-per-watt, and optimize resource utilization for HPC and AI workloads. It also explains how administrators can monitor infrastructure, control power consumption, and maximize system throughput within available power budgets.
This paper is intended for HPC/AI architects, system administrators, data center operators and managers, and HPC/AI practitioners. Readers should be familiar with HPC or AI cluster architectures, workload scheduling, and basic power and performance concepts.
Overview
This white paper addresses the growing challenges faced by modern HPC and AI data centers in the context of rising power density, increasing energy consumption, and infrastructure power limits. It introduces the Energy Aware Runtime (EAR) as a comprehensive solution to monitor, analyze, and optimize power and energy usage while maintaining performance and operational efficiency.
The first part of the document introduces the power‑ and energy‑related challenges currently faced by HPC and AI data centers. It explains the relationship between power, energy, and operational costs, discusses the impact of data center power limits, and examines these challenges from the perspective of key stakeholders, including end users, system administrators, and data center managers. This part also presents the origins and evolution of the EAR project, providing context for the design choices behind EAR.
The second part focuses on the internal architecture and functional building blocks of EAR. It describes the core concepts, services, and design principles of the Energy Aware Runtime, as well as the difference between the open‑source EAR core and the commercially supported EAR product. This part also introduces the overall product structure, available feature sets, trial options, and explains how the different EAR products can be ordered through Lenovo.
The third part of the document illustrates how EAR is used in production HPC and AI environments. It presents practical usage examples from the perspectives of end users, system administrators, and data center managers, including the integration of EAR with common resource managers such as Slurm, PBS Pro, and Kubernetes. The focus is on real‑world operational workflows, covering monitoring, accounting, energy optimization, smart power capping, and advanced analytics, to provide a clear understanding of how EAR supports day‑to‑day operations and long‑term optimization in practice.
Introduction to the Energy Aware Runtime Concept
The semiconductor industry continues to advance both chip design and manufacturing processes. Finer feature sizes enable a higher number of transistors per unit area, while emerging manufacturing techniques, such as 3D integration, provide unprecedented transistor density. This increased density, combined with operation at higher clock frequencies to improve performance, has resulted in a steady rise in the thermal design power (TDP) of modern computing components.
Over the past decade, the power consumption of data center server components has increased substantially. For example, the power draw of high-end central processing units (CPUs) has risen from approximately 145 W to up to 550 W, while data center accelerators, such as graphics processing units (GPUs), have seen increases from roughly 250 W to as much as 1100 W. In addition, the total power consumption of server memory has grown, driven both by higher power requirements per individual memory module (DIMM – Dual In-line Memory Module), and by the increasing number of DIMMs supported per processor. Networking adapters exhibit a similar trend, with power consumption steadily increasing over time.
Power and Energy Challenges for HPC and AI Data Centers
In addition to that significant rise of Direct Current (DC) power consumption at the core server component level, the power for cooling the systems by moving air with high-speed fans has also increased significantly. The Alternating Current (AC) power required by an air-cooled AI server equipped with 8 GPUs can easily exceed 10 kW today. Consequently, the peak power consumption of a single 19-inch rack populated with high-end GPU servers has increased from approximately 60 kW to something like 180 kW.
This trend toward higher computing density shows no signs of abating. Future generations of CPUs, GPUs, memory, and networking components are expected to further drive extreme power density and rising high energy consumption. These developments pose significant challenges for data centers, particularly with respect to power delivery, cooling, and operational efficiency. In this paper, we examine these challenges in greater detail and demonstrate how the Energy Aware Runtime (EAR) can help mitigate their impact.
How are power and energy related?
For the discussion on energy costs and power capacity, it is important to clarify the relationship between electrical power and electrical energy.
- Electrical energy refers to the amount of work performed by electricity over a given period of time. It is typically measured in kilowatt-hours (kWh), although it can also be expressed in Watt-seconds (Ws) or Joules (J). Data centers are charged by electricity providers based on the total electrical energy consumed over a defined billing period (e.g., monthly).
- Electrical power, measured in Watts (W), describes the rate at which electrical work is performed at a specific point in time. The peak (i.e., worst-case maximum) electrical power demand of IT equipment is a critical parameter for sizing data center power delivery and distribution infrastructure, including transformers, busbars, fuses, and power cables.
Electrical energy and electrical power are closely related but represent distinct aspects of electricity consumption: energy focuses on cumulative usage over time and associated costs, while power emphasizes instantaneous demand and infrastructure requirements.
How are rising operational costs (OPEX) reshaping the definition of efficiency goals?
Historically, the primary efficiency objective in operating high-performance computing (HPC) systems was the optimal utilization of capital expenditure (CAPEX). Accordingly, the dominant goal was to maximize throughput over the lifetime of the system, often described as minimizing the time to solution. This objective was pursued through optimized job scheduling to achieve high system utilization, combined with operating compute nodes at their maximum performance levels.
Due to the steadily increasing power consumption of HPC clusters and rising electricity costs, the operational expenditure (OPEX) associated with running an HPC system has grown to a level where it now represents a significant, and in some cases comparable, portion of the total cost relative to CAPEX. As a result, an additional efficiency objective has emerged: maximizing system throughput per unit of energy consumed, commonly referred to as energy to solution. Achieving this objective requires operating compute nodes not exclusively at peak power, but rather at energy-optimal performance levels. Balancing the two competing objectives – time to solution and energy to solution – constitutes a complex optimization problem that often requires customization for each individual application workload.
As server acquisition costs continue to rise and power availability becomes a growing constraint, data centers are increasingly focused on maximizing the value of their infrastructure investments. Achieving high resource utilization across compute, storage, and networking environments is a complex challenge, requiring organizations to balance performance, cost, and operational efficiency. Depending on the specific objectives, the optimization target may be CAPEX, OPEX, or both.
To manage this complexity, a dedicated mechanism is required that can determine the appropriate power-performance operating point for a given optimization goal and provide an automated means of enforcing the corresponding power controls on the compute nodes.
Why do data center power limits pose a growing concern, and how to mitigate it?
Existing data centers are equipped with electrical infrastructure that was designed to meet the power requirements anticipated at the time of their planning and construction. Upgrading this infrastructure to accommodate the extreme power densities of the latest server generations can be prohibitively expensive or, in some cases, technically infeasible. As a result, a data center may face a hard upper limit on the total electrical power that can be delivered to IT equipment. Consequently, operators may be unable to support the maximum aggregate power demand of all installed systems simultaneously.
In day-to-day operation, this limitation may not pose an issue as long as the aggregate power consumption of the applications and jobs running on the system remains below the data center’s maximum available power. The operational challenge is to maintain power demand within the applicable facility or cluster power constraint, including any policies governing short-duration peaks.
One possible approach to address this challenge is to distribute the available power budget evenly across all compute nodes and enforce a strict power cap on each node individually. In a simplified example, if 1 MW of the available IT power budget were assigned to 1,000 identical compute nodes, a static allocation would provide 1 kW per node. This hard power limit can be implemented locally on each compute node using hardware- or firmware-level power management mechanisms provided by the platform, such as Intel Intelligent Node Manager or NVIDIA GPU Power Management. This approach has several inherent disadvantages:
- Limited scope of power capping mechanisms. In many cases, power capping tools operate only at the level of specific components, such as CPUs or GPUs, and do not account for the total power consumption of an entire compute node. The latter typically includes additional contributors such as network adapters, storage devices, power conversion losses, and the baseboard management controller (BMC). As a result, these auxiliary power consumers must be incorporated into the overall power budget through separate or indirect mechanisms.
- Lack of workload awareness and flexibility. The described method is inherently static and fails to consider that different jobs or applications running concurrently on the system can exhibit vastly different power and performance characteristics. Enforcing a fixed power cap on each individual compute node can unnecessarily throttle applications that could benefit from additional power, even when unused power capacity is available at the data center level. For example, other compute nodes may be idle or executing workloads with power consumption well below their allocated budgets. This static capping strategy can therefore lead to inefficient utilization of available resources and a reduction in overall system throughput compared to what could be achieved within the same aggregate power budget.
To overcome these limitations, a comprehensive power control system is required that:
- Monitors and understands application-level power behavior while workloads are executing,
- Is aware of the maximum total power available to all compute nodes at the system or data center level, and
- Dynamically allocates the global power budget across compute nodes intelligently that accounts also for the individual power requirements of running applications.
EAR Smart Power Cap dynamically allocates the available cluster power budget across nodes according to workload and system conditions, helping maximize throughput while maintaining the defined power constraint.
Stakeholder Perspectives on Energy Optimization
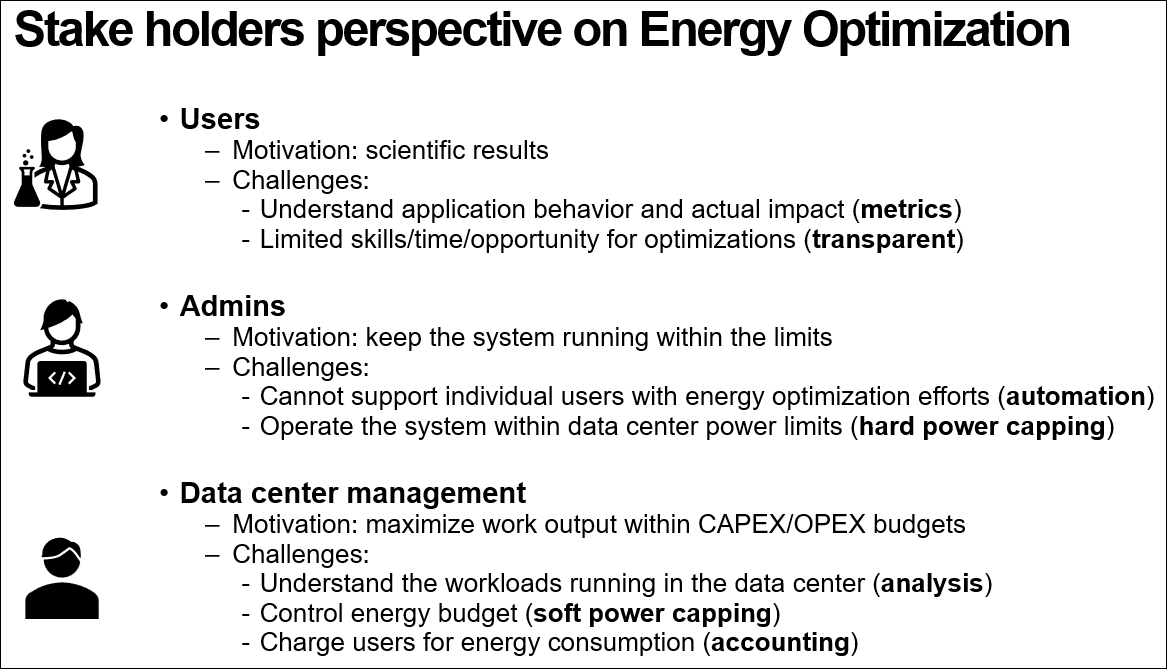
In HPC and AI environments, multiple stakeholders are involved, each with potentially different perspectives on energy optimization. In the following, we discuss the viewpoints of several key stakeholder groups and their respective requirements.
End users
For users of HPC or AI systems, the platform primarily serves as a tool to achieve scientific or business objectives, such as running large-scale simulations or training AI models. Energy optimization is typically not a primary concern, and users often have limited visibility into the amount of energy consumed by their workloads. However, users may become interested in energy consumption if relevant information is made easily accessible or if energy usage is reflected in accounting or chargeback models. Users that lack the time or expertise to manually optimize their applications for energy efficiency, an automated and transparent mechanism that optimizes energy consumption on their behalf is likely to be well received.
System administrators
System administrators are responsible for operating the system reliably within defined technical and organizational constraints. They usually cannot devote significant effort to providing in-depth energy optimization support to individual users and therefore depend heavily on automation. An automated, policy-driven framework that enables energy-efficient system operation can significantly support them in fulfilling their responsibilities. In addition to energy efficiency, the continuously increasing power demand of modern HPC and AI systems introduces another major challenge: ensuring that system operation remains within the limits of the available power infrastructure. Automated power control mechanisms are particularly valuable in addressing this requirement.
Data center management
From the perspective of data center management, the primary objective is to maximize overall system value within given capital expenditure (CAPEX) and operational expenditure (OPEX) budgets. Achieving this goal requires visibility into key metrics such as system performance, throughput, and energy consumption. Since energy costs often constitute a substantial fraction of OPEX, management not only requires monitoring capabilities but also effective mechanisms for controlling energy consumption over defined billing periods. Furthermore, the ability to attribute energy-related costs to individual users or workloads through accounting or chargeback mechanisms is essential for establishing fair and transparent cost allocation models.
The Energy Aware Runtime (EAR) Project
Development of Energy Aware Runtime (EAR) began in 2016 through a collaboration between Lenovo and the Barcelona Supercomputing Center (BSC). To fully understand the capabilities of EAR and the underlying design principles, it is useful to review its origins and subsequent evolution.
Initial Implementations of Energy-Aware HPC Job Execution
Approximately 15 years ago, an important observation emerged in the HPC community: different applications can exhibit markedly different performance characteristics, which are often described using two extreme categories – CPU-bound and Memory-bound workloads.
- CPU-bound applications benefit significantly from higher processor frequencies. Their performance, which is generally represented as the total wallclock time to complete a simulation, typically scales with CPU frequency and degrades noticeably as frequencies are reduced.
- Memory-bound applications, in contrast, derive comparatively little benefit from increased CPU frequencies. While their performance may improve marginally at higher frequencies, the gains are generally much smaller than CPU-bound workloads. Likewise, reducing CPU frequency often has a limited impact on their overall performance, as execution is primarily constrained by memory access rather than raw computational throughput.
This observation led to the first attempts to exploit application-specific performance characteristics to reduce the energy consumption of HPC clusters. One early approach was to leverage the batch scheduling system to select appropriate CPU frequency settings for individual jobs, based on whether the application was classified as CPU-bound or Memory-bound.
These concepts were implemented in the Energy Aware Scheduling functionality of the IBM LoadLeveler scheduler and were deployed in production on HPC systems like LRZ [1]. However, operational experience revealed several limitations:
- Static application profiling requirements. The batch scheduling system required a mechanism to determine the application profile (CPU-bound or Memory-bound) before a job was launched. This was addressed through a static mapping between application names and performance profiles. Maintaining this mapping required manual effort from both application owners and system administrators. Specifically, application behavior had to be analyzed under different CPU frequency settings, and the profile assignment table had to be updated accordingly.
- Mismatch between static profiles and runtime behavior. During system operation, it becomes evident that the predefined static relationship between an application and its performance profile did not always reflect the actual behavior of a running job. Further analysis showed that application characteristics can vary significantly between different job instances or across distinct execution phases within a single job. In extreme cases, the same application can behave as CPU-bound or Memory-bound depending on the input data set. As a result, static application-to-profile mappings proved insufficient for reliable energy optimization in real-world HPC workloads.
Design Principles of the Energy Aware Runtime (EAR)
Building on previous experience, a new approach for an Energy Aware Runtime (EAR) was conceived with the following objectives.
- Dynamic profiling: Determine the performance characteristics of a job while it is running, rather than relying on static assumptions.
- Performance and power modeling: Estimate application performance at different CPU frequency levels and assess the corresponding impact on power consumption.
- Adaptive frequency control: Make dynamic decisions to select an energy-optimized CPU frequency during execution and periodically re-evaluate and adjust these settings as needed.
- Scheduler independence: Operate independently of the batch scheduling system to enable real-time optimization without requiring prior job classification or user inputs.
This approach was implemented as an open-source software solution through a collaboration between Lenovo and the Barcelona Supercomputing Center (BSC). EAR was first deployed on large HPC clusters in 2019 and has since been running in production across multiple sites like LRZ SuperMUC NG [2] [3] and SURF Snellius [4]. Over time, it has undergone continuous improvements and feature enhancements, such as soft and hard power capping, driven by customer feedback and evolving system requirements.
Evolution into a Supported Product
Since 2020, the development and support of EAR have been professionalized through the establishment of a dedicated company, Energy Aware Solutions (EAS). EAS provides a growing team of developers and support specialists focused on enhancing the EAR core, developing EAR extensions included in the EAR Product as well as delivering implementation, training, and support services.
Beyond CPU energy optimization, EAS has extended EAR’s capabilities to include GPUs and introduced advanced features such as smart analytics tools. These enhancements go beyond the open-source EAR core and are offered as licensed extensions in the EAR Product, bundled with professional support services.
Integration with Lenovo ThinkSystem Neptune Servers
Total node DC power is one of the foundational metrics that EAR uses for its internal energy modeling. EAR supports multiple plugins to retrieve power metrics through different generic system interfaces. Those interfaces provide data through sensors mostly limited in the scope of what they measure (e.g. NVIDIA tools provide power data for the NVIDIA GPUs, but not for the network adapters in the system) or the accuracy of the measurements (e.g. DC power data retrieved from power supplies over system internal busses is measured at limited frequency and usually low accuracy).
Lenovo ThinkSystem Neptune DWC (direct-water-cooled) servers have dedicated hardware sensors that provide accurate measurements of the total node DC power. In addition, there is a hardware accumulator for metering the Energy consumption with a high sampling rate of ~100Hz. The ThinkSystem SD665 V3 Neptune DWC servers (and other ThinkSystem Neptune DWC servers of same or previous generations) expose that DC power and energy data through the Fast/Accurate Power and Energy Meter (FAPM) IPMI interface. The latest generation of ThinkSystem Neptune DWC systems, starting with ThinkSystem SC750 V4 Neptune DWC Server, the same information is now provided through the Redfish FastAccuratePowerService.
An EAR plugin for the data provided by FAPM is already available, and support for the FastAccuratePowerService is planned for a future release. These technologies are integral components of Lenovo ThinkSystem Neptune DWC servers, providing precise, real-time measurements of node-level power and energy consumption. By leveraging this high-resolution DC power telemetry, EAR can build more accurate energy models, improve workload characterization, and dynamically optimize system performance and energy efficiency.
EAR Architecture and Product Structure
- EAR Architecture
- Structure of EAR: Open Source and Commercial Extensions
- Testing EAR through the Trial Program
- Ordering EAR through Lenovo
EAR Architecture
EAR uses a distributed architecture that integrates workload-level runtime components, node-level monitoring and control services, cluster-level management services, and a centralized data-management layer. Together, these components support application monitoring, energy and performance accounting, runtime optimization, and cluster-level power management.
EAR Services
- Application Manager(EARAM): Provides application monitoring, accounting and optimization.
- Node Manager(EARD): Provides node-level monitoring and node power capping.
- System Power Manager (EARGM): Provides cluster-level monitoring and cluster power capping.
- Database manager(EARDBD): Provides database access, data buffering, and data aggregation.
- Scheduler supportcomponent(EARPlug): Loads the EAR environment to connect with EARAM and interfaces with EARD to apply default power configurations.
CLI and Tools
- EAR analytics tools: The job-analytics and system-analytics tools provide insights to improve job-level and system-level resource utilization.
- EAR CLI: Provides easy access to database metrics for job accounting and system monitoring, as well as dynamic configuration at the node and cluster levels.
EAR Service Interactions
The following figure illustrates the EAR services when running in a Slurm cluster and the main interactions between them. On each compute node, EARAM, EARD and the scheduler support plugin are active, where the specific plugin implementation depends on the scheduler in use.
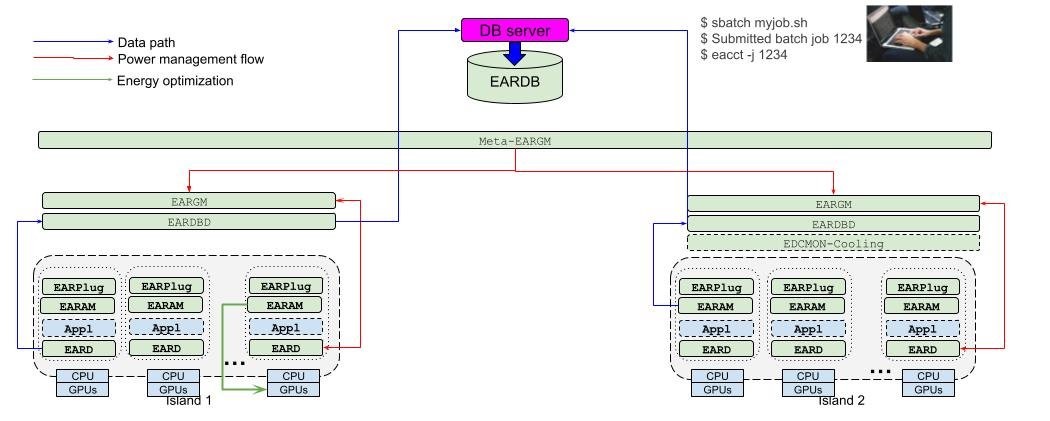
Figure 2. Architectures of the EAR services
Power management is implemented through the interaction between the System Power Manager (EARGM) and the Node Manager (EARD). The system power manager is responsible for cluster-level power allocation, while the node manager enforces intra-node power allocation.
The data path, covering application accounting and system monitoring, flows from the Application Manager (EARAM) and Node Manager (EARD) running in compute nodes to the Database Manager (EARDBD), which forwards the data to the database server. The EARDBD also aggregates selected data to generate additional records.
Finally, dynamic energy optimization is performed by the Application Manager (EARAM).
Structure of EAR: Open Source and Commercial Extensions
EAR today consists of both open-source and proprietary components.
Open-source Core and EAR Products
- EAR Core: The open-source version of EAR, licensed under EPL 2.0 and jointly developed by the Barcelona Supercomputing Center (BSC) and Energy Aware Solutions (EAS). EAR Core provides CPU + GPU monitoring and smart power cap
- EAR Extensions: Proprietary features developed by EAS and distributed under a commercial license. These include advanced capabilities such as EAR accounting, EAR GPU energy optimization policies, EAR job analytics tool for job-level analysis, and the EAR system analytics tool for system-wide monitoring and reporting.
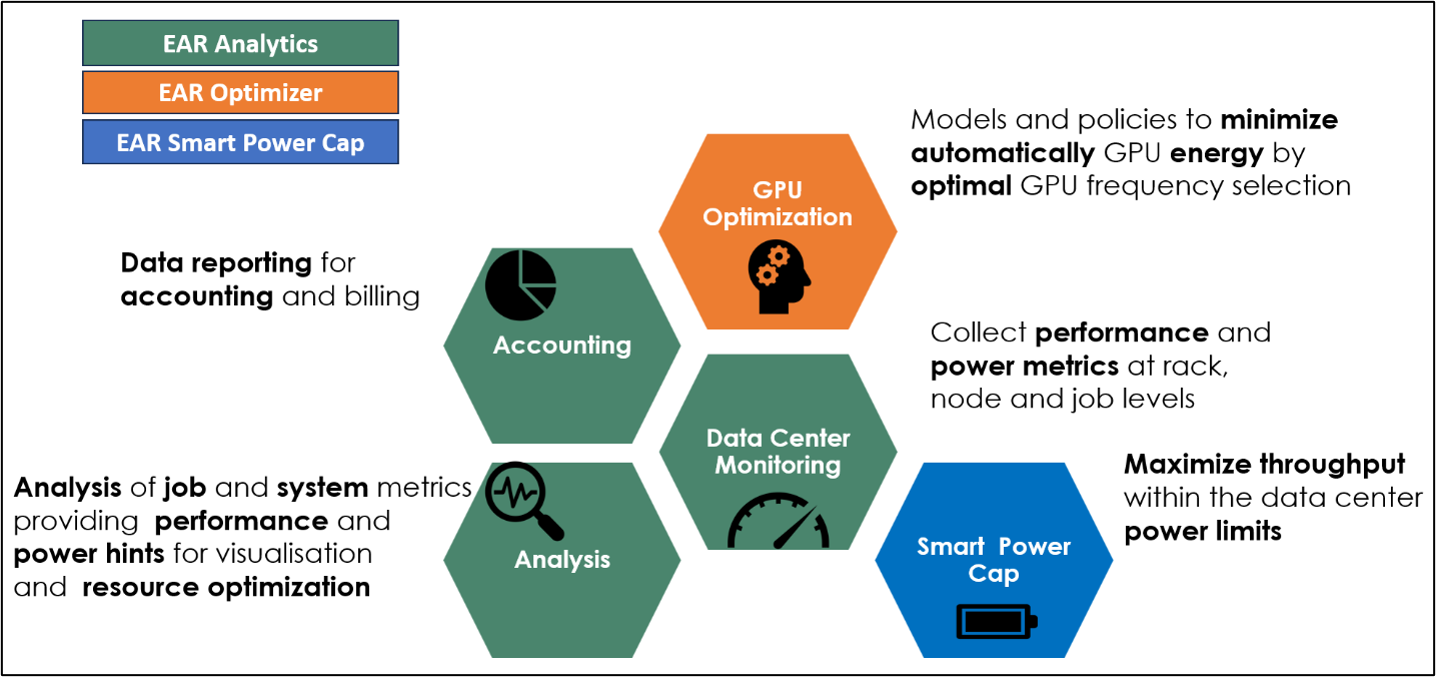
The EAR Product packages selected features of EAR Core and EAR Extensions into a unified solution that is available in three configurations:
- EAR Analytics (base configuration)
- EAR Optimizer (optional)
- EAR Smart Power Cap (optional)
The EAR Product represents the comprehensive solution offered by EAS and includes:
- EAR Core, the open-source component
- EAR Extensions, which provide proprietary advanced capabilities
- Professional services, including installation, configuration, training, and ongoing support
Figure 3 illustrates the functional differences between EAR Core and the EAR Product.
To allow customers to evaluate EAR prior to purchase, a Trial Program is available. It allows users to test EAR on their own systems with a limited subset of features. More details on the Trial Program are provided in the section “Testing EAR through the Trial Program”.
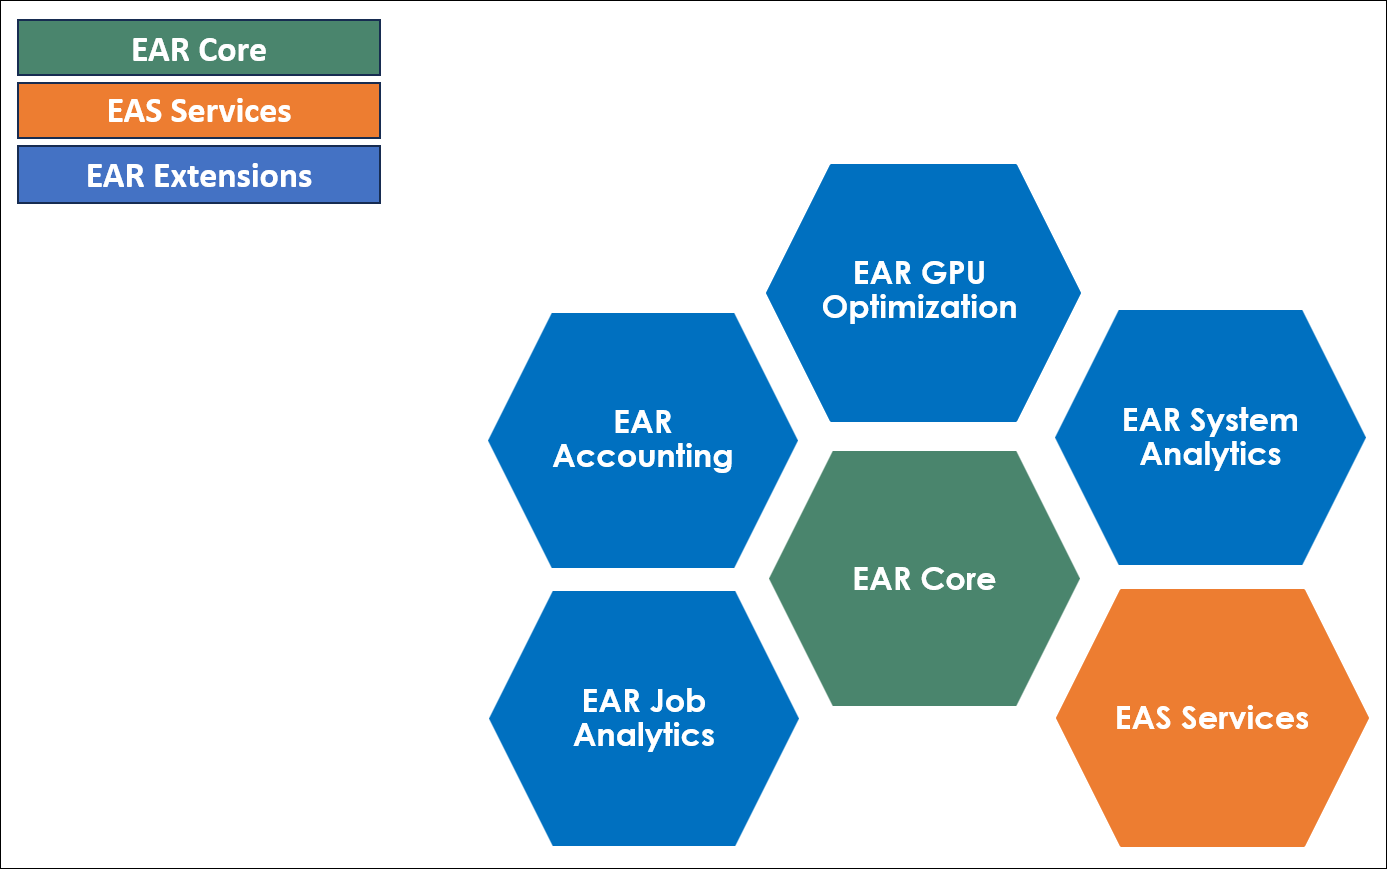
Figure 3. EAR Core vs EAR Products
EAR Commercial Configurations
EAS provides a base configuration (EAR Analytics) and two optional additional configurations (EAR Optimizer and EAR Smart Power Cap), each designed to address different levels of functionality and operational needs.
- EAR Analytics: The foundational commercial configuration for supported monitoring, accounting, visualization, and analysis. It Includes data center monitoring, EAR accounting and data analysis with Grafana, EAR job analytics for job-level insights, and EAR system analytics for system-wide analysis. In addition, both User and Administrator training courses are delivered by EAS. All required EAS Support services are included.
- EAR Optimizer: Built on top of EAR Analytics by adding the GPU energy optimization module. EAR Optimizer evaluates workload behavior and selects GPU operating frequencies intended to reduce energy to solution while remaining within a user- or administrator-defined performance-impact threshold. All required EAS Support services are included.
- EAR Smart Power Cap: Built on top of EAR Analytics by adding the Smart Power Cap module, providing advanced power management capabilities to achieve optimal performance within a given power budget. EAS implementation is mandatory for this product. All required EAS Support services are included.
This modular approach allows customers to select the configuration that best fits their needs, choosing from the following options:
- EAR Analytics
- EAR Analytics + EAR Optimizer
- EAR Analytics + EAR Smart Power Cap
- EAR Analytics + EAR Optimizer + EAR Smart Power Cap
Overview of Features Included in EAR
Data Center Monitoring
The core of the EAR software includes a dynamic and extensible data center monitoring capability, implemented in a distributed manner across multiple EAR components. This feature collects information from compute nodes, jobs, applications, and devices within the data center.
- Compute Node Level: EAR gathers hardware-level performance and energy metrics, including average CPU frequency, DC power consumption, CPU, DRAM, and GPU energy usage, as well as thermal indicators.
- Job Level: Jobs are created by the scheduler, and EAR collects power metrics (DC power, CPU, GPU, and DRAM) along with performance metrics such as execution time, average CPU/GPU frequency, GFlops, CPI, CPU and GPU memory bandwidth, floating point activities, and related metrics.
- Application Level: Unlike jobs, applications may consist of multiple steps. EAR dynamically detects application creation by intercepting new processes. It collects performance and power metrics at two granularities:
- Runtime signature: Periodic signature per-process monitoring.
- Application signature: Represents aggregated metrics for the entire process. EAR supports multiple applications running concurrently on a single node (node sharing). In such cases, each application receives its own signature, computed using per-process metrics and node-sharing models for node-level metrics such as DC power.
- Data Center Level: EAR monitors AC power consumption for compute racks and non-compute devices, including storage, networking, and cooling infrastructure.
Accounting
All information collected by EAR is reported through a configurable reporting system that uses a dedicated library for data export. This library provides a pluggable API, which can be configured at runtime to support multiple reporting plugins simultaneously.
This flexibility allows EAR to report data to various backends, including:
- Relational databases (e.g., MySQL)
- Non-relational databases (e.g., Prometheus, Examon)
- Local storage formats (CSV files and log files)
Although EAR defines its own data types for applications and compute node metrics, the reporting API includes a generic key-value interface, enabling the integration of new data types and ensuring compatibility with both relational and non-relational database systems.
Data Analysis
Data collected by EAR is analyzed both at runtime and post-mortem to support optimization policies and provide actionable insights through the EAR Analytics tools.
- Runtime Analysis: During execution, EAR classifies runtime signatures to identify performance-critical regions, such as GPU idle periods or phases with elevated power consumption. It then dynamically selects the most appropriate performance model and coefficient set to optimize its behavior for the current workload and GPU architecture.
- Post-Mortem Analysis: EAR Job Analytics tool processes collected data together with scheduler information to deliver deeper insights in the form of actionable hints. These hints include:
- Recommendations for improving resource utilization
- Guidance on system configuration relative to workload characteristics
- System-level and job-level statistics for a comprehensive understanding of real workload behavior and application performance profiles.
By combining runtime optimization with post-execution analytics, EAR enables both immediate energy savings and long-term improvements in system efficiency.
GPU Optimization
EAR leverages runtime-collected data to dynamically characterize application behavior and predict execution time and power consumption at different GPU frequency settings. This enables EAR’s optimization policies to adapt the GPU frequencies in response to the potentially changing behavior of applications during execution.
EAR’s optimization models are architecture-specific, and combine hardware metrics that influence execution time and power consumption. EAR refers to this set of model coefficients as the system signature, characterizing time and power variation vs frequency. The system signature, together with the runtime signature, combines hardware-specific characteristics with workload activity, resulting in a unique and highly adaptive optimization approach. EAR includes pre-computed coefficients for several NVIDIA GPU models.
EAR optimization policies use the EAR optimization models to minimize the GPU energy within a given performance impact threshold defined dynamically or statically by the user or the system administrator. This performance threshold can be, for example, 5% or 10% depending on the data center policy.
Smart Power Cap
In modern supercomputing environments, power limitations are increasingly common. In some data centers, the available electrical capacity is insufficient to operate all compute nodes at their maximum frequency. In other cases, temporary restrictions arise due to cooling constraints, weather conditions, or other operational factors. Regardless of the cause, the system must operate within defined power and thermal limits, complementary to energy optimization objectives.
The key concept behind Smart Power Cap is to allocate the available power budget across compute nodes based on the energy efficiency of the running workloads. By applying this energy-aware power distribution strategy, EAR maximizes overall system throughput while ensuring compliance with operational constraints.
Testing EAR through the Trial Program
Customers can evaluate EAR prior to purchase through a Trial Program. The Trial allows customers to test a subset of EAR features on a limited portion of their cluster for a limited duration, typically 4 weeks.
As part of the Trial Program, EAS provides EAR either as an RPM package or a containerized version, along with the necessary documentation, enabling customers to perform the installation independently. Once the EAR Trial is successfully deployed, the EAS team conducts weekly meetings with the customer to answer questions and to discuss observed results on applications and system behavior.
At the end of the trial period, customers have the option to order the full EAR Product through Lenovo.
Ordering EAR through Lenovo
EAR Products can be purchased through Lenovo and are delivered and supported by Energy Aware Solutions (EAS).
The following information is required to order EAR:
- The combination of EAR modules to be offered, as described in the section “EAR Products proposed by EAS”
- The total number of compute nodes eligible to actively run applications (for example, all compute nodes defined in the Slurm configuration)
- The number of CPU-only nodes and the associated number of CPU sockets
- The number of GPU nodes and the associated number of GPU sockets (CPU sockets in GPU nodes are not counted)
There are no predefined limits on the number of supported nodes or GPU sockets. A quotation from EAR is required for all EAR deployments.
Operational Use of EAR in HPC and AI Environments
- Integration with Resource Managers
- User Perspective on EAR Usage
- System Administrator and Data Center Manager Perspective on EAR usage
Integration with Resource Managers
Slurm (SchedMD)
EAR is designed to integrate seamlessly with Slurm through the SPANK (Slurm Plug-in Architecture for Node and job Kontrol) plugin [6]. SPANK allows dynamic modification of the job launch process, such as extending or overriding environment variables. In the context of EAR, SPANK plugins interact with the EARD (EAR Daemon) to notify job events and with the EARAM (EAR Application Manager) to track new/end process events.
The following table illustrates how EAR extends the srun and sbatch command-line options in Slurm.
Note that the use of these options is restricted to authorized users.
- srun example
The example below configures the power policy to optimization with a time impact limit set to 10% (policy threshold).
[user]$ srun \
--ear-policy=optimization \
--ear-policy-th=0.1 \
-N 1 -n 32 –tasks-per-node=32 <your_application>
- sbatch example
When using sbatch, EAR options can be specified either through #SBATCH directives in the script file or superseded using srun options in subsequent calls. This is useful when running multiple srun commands with different EAR parameters within the same batch script.
The following example illustrates this:
#!/bin/bash
#SBATCH -N 1
#SBATCH --ntasks=32
#SBATCH --tasks-per-node=32

srun --ear-policy=monitoring <your_application>
srun --ear-policy=optimization <your_application>
PBS Pro (Altair/Siemens)
Integration with PBS Pro [17] is achieved through its hook mechanism, which enables the execution of custom code in response to job-related events on compute nodes. These hooks facilitate communication with the EARD daemon and ensure that EAR is properly initialized in accordance with job execution.
The following example illustrates an MPI application executed under PBS Pro with EAR, where a specific CPU frequency is explicitly requested. As shown in the example, when using PBS Pro, EAR configuration options are provided via environment variables, which are passed to the job using the –v option.
#!/bin/bash
#PBS -N mpi_test
#PBS -l select=1:ncpus=4:mpiprocs=4
#PBS -l walltime=00:10:00
#PBS -j oe
#PBS -v "EAR_CPUFREQ=2401000,EAR_POLICY=monitoring"

mkdir -p db

# Load the cray-mpich module
module load cray-pals

# Run the MPI program
mpiexec -n 4 ./mpi_test

# Run same use case with erun and specific flags
mpiexec –n 4 erun --ear-policy=monitoring --ear-cpufreq=2000000 --program="./mpi_test"
With PBS pro, the erun command is also supported, allowing the same syntax used with Slurm flags to be reused when running jobs under PBS Pro via erun.
Kubernetes (K8s)
In the case of Kubernetes, support for automatic execution with EAR is provided through a K8s webhook. The webhook acts as an HTTP server that intercepts requests from the K8s API server and, in this context, mutates the Pod specification. Specifically, it modifies the Pod environment to bind the container to the EAR loader and sets the required environment variables that allow the loader to communicate with the EAR service.
The current EAR webhook offers limited configurability and is designed to apply a default EAR configuration to running workloads.
User Perspective on EAR Usage
In this section, we describe how end users can interact with the Energy Aware Runtime across several common use cases. It is important to note that users are not required to actively engage with EAR; in typical deployments, EAR operates automatically “under the hood”, allowing users to work with the system exactly as they would on a cluster without EAR installed. Nevertheless, depending on the system configuration, users may influence EAR’s behavior – for example, by selecting policies – and can also retrieve detailed information from EAR when desired.
- Accounting Command: eacct
- GPU Energy Optimization
- Advanced Job Visualization Tools
- Resource Optimization with the EAR Job Analytics
- Kubernetes Use Case: POD Specification and Submission
Accounting Command: eacct
The EAR accounting command, eacct, is a command-line tool for users and administrators that provides a simple interface to display data collected by EAR for applications. For non-privileged users, eacct reports data only for their own applications, while authorized users can access accounting information for any application in the system. The tool offers multiple flags to filter results – such as job ID, step ID, application name, start time, end time, and more. The full list of options is available through eacct --help or the corresponding manual page (man eacct).
- Job Accounting Summary
The example below illustrates how to retrieve a job summary using eacct together with the job ID of a completed job (-j option highlighted in green). The command prints average values computed for the entire job execution, as well as per-step averages according to Slurm’s job-step terminology. The output includes a variety of useful metrics, such as average power (W), total job energy consumption (kWh), memory frequency and bandwidth, cycles per instruction (CPI), GFLOPS per watt, and several GPU-related performance and energy metrics. EAR IDs and metrics are shown in blue, and two rows are reported: The row with the ID “1514938-sb” shows the job metrics (sb stands for “sbatch”). Depending on the metric, it is shown the average or the accumulated value. See below for more details.
[user]$ eacct -j 1514938
JOB-STEP     AID        APPLICATION      POWER(W)   NODES      AVG/DEF/MEM(GHz) […]
1514938-sb   0          gromacs_monitori 2144       1          3.49/2.80/--
1514938-0    2569815    gmx              2183       1          3.49/2.80/2.48

[…]
TIME(s)    GBS     CPI   GFLOPS/W   ENERGY(KWh)
649        ---     ---   ---        0.39
646        41      2.22  0.01       0.39

[…]
G-POW (T/U)     G-FREQ   G-UTIL(G/MEM)  G-GFLOPS
--     /--      ---        ---%/---%    ---
1720.35/1720.35 1.973       80%/5%      17190.51
- Detailed Job Accounting
The EAR database also stores detailed loop signatures for each job. During execution, EAR records metrics on every iteration of its internal loop (by default, every 10 seconds). These time-series data can be visualized by adding the “-r” flag to the eacct command. This option prints additional CPU- and GPU-related metrics, as illustrated in the example below.
I[user]$ eacct -j 1514938 -r
JOB-STEP     AID        TIMESTAMP  POWER(W)
1514938-0    2569815    11:43:28   1199
1514938-0    2569815    11:43:38   1399
1514938-0    2569815    11:43:48   1916
[…]
1514938-0    2569815    11:54:01   2123
GBS     TPI      CPI   GFLOPS/W   TIME(s)    AVG/DEF/MEM(GHz) MEM(GHz)
13      0        1.86  0.00       1.003      3.50/2.80/2.48   2.48
19      0        2.20  0.01       1.005      3.49/2.80/2.26   2.26
25      0        2.26  0.00       1.007      3.49/2.80/2.46   2.46
[…]
37      0        2.22  0.01       1.007      3.48/2.80/2.49   2.49

G-POW (T/U)     G-FREQ   G-UTIL(G/MEM)  G-GFLOPS
912.04 /912.04  1.980       29%/1%      16260.66
1017.16/1017.16 1.980       41%/2%      11591.17
1425.17/1425.17 1.980       57%/3%      17979.44
[…]
1688.99/1688.99 1.980       75%/4%      15014.68
- CSV Data Export
The eacct command allows users to extract profiling data into CSV files after job completion. It is possible to generate one CSV file for each node participating in the job, enabling detailed, node-level analysis.
This capability supports further investigation of application behavior; for example, users can compare how an application performs across different nodes. In the plot below, we illustrate how the exported CSV files can be used to visualize memory bandwidth utilization over time and across multiple nodes.
[user]$ eacct -j 1514938 -r --csv ear.1514938.csv
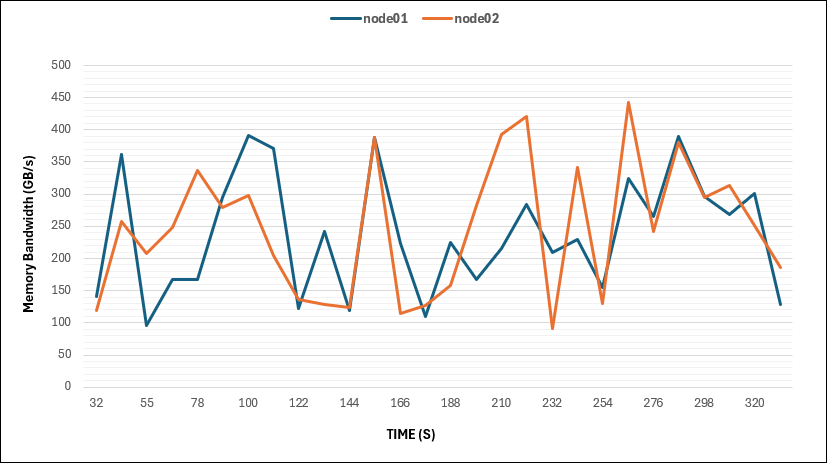
Figure 5. Profiling the memory bandwidth
The rich set of metrics reported by EAR makes it an effective and accessible profiling tool: it is fully integrated with the job scheduler, easy for users to access, and requires no third-party tools to be installed by either end users or system administrators.
- Advanced GPU Metrics
EAR retrieves advanced GPU metrics through the NVIDIA Management Library (NVML), enabling deeper insight into GPU behavior during application execution. For example, when investigating whether an application efficiently utilizes NVLink for inter-GPU communication, these metrics provide a simple and effective way to validate and analyze communication patterns and data movement characteristics.
The following list summarizes the GPU-related metrics collected by EAR during job execution:
- GR_ENGINE_ACTIVE
- SM_ACTIVE
- SM_OCCUPANCY
- TENSOR_ACTIVE
- DRAM_ACTIVE
- FP64 / FP32 / FP16 _ACTIVE
- PCIE_TX_BYTES
- PCIE_RX_BYTES
- NVLINK_TX_BYTES
- NVLINK_RX_BYTES
Using the eacct command to generate CSV files, users can produce useful graphics, such as the example below, which shows NVLink received data.
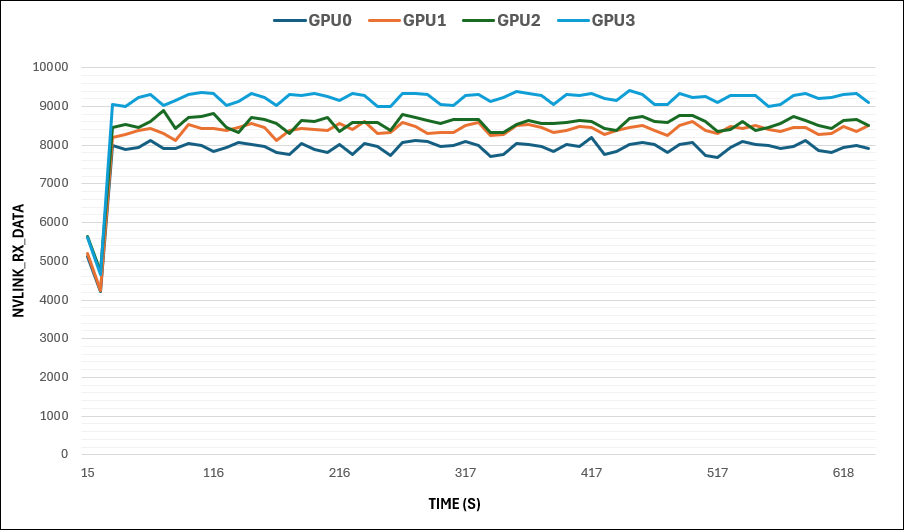
Figure 6. NVIDIA DCGM NVLink received data
GPU Energy Optimization
The GPU energy optimization feature in EAR is able to determine the optimal GPU frequency that satisfies a given energy policy before the frequency is actually changed. The supported policy is “Minimize Energy to Solution”, under a user- or administrator-defined constraint. This constraint specifies the maximum allowable performance impact that a frequency adjustment may introduce for the application (or for the active iteration of the application).
For nodes equipped with GPUs, the node-level DC energy includes CPU, DRAM, GPU, HBM, and all other components, including GPU-related infrastructure such as switches when applicable. This extended policy is referred to as “GPU energy optimization”. In these systems, EAR reports not only the node-level DC power but also the detailed breakdown of all subcomponents listed above.
EAR’s ability to predict the impact of a potential frequency change – both in terms of performance and power – before applying it relies on performance and power models. These models are trained prior to EAR installation to learn the characteristic behavior of each hardware component in the system (e.g., GPU signature). This hardware-specific characterization is called the “system signature”. If the system or cluster is composed of multiple node types or configurations, a distinct system signature is computed for each homogeneous partition.
This process is summarized in the following figure:
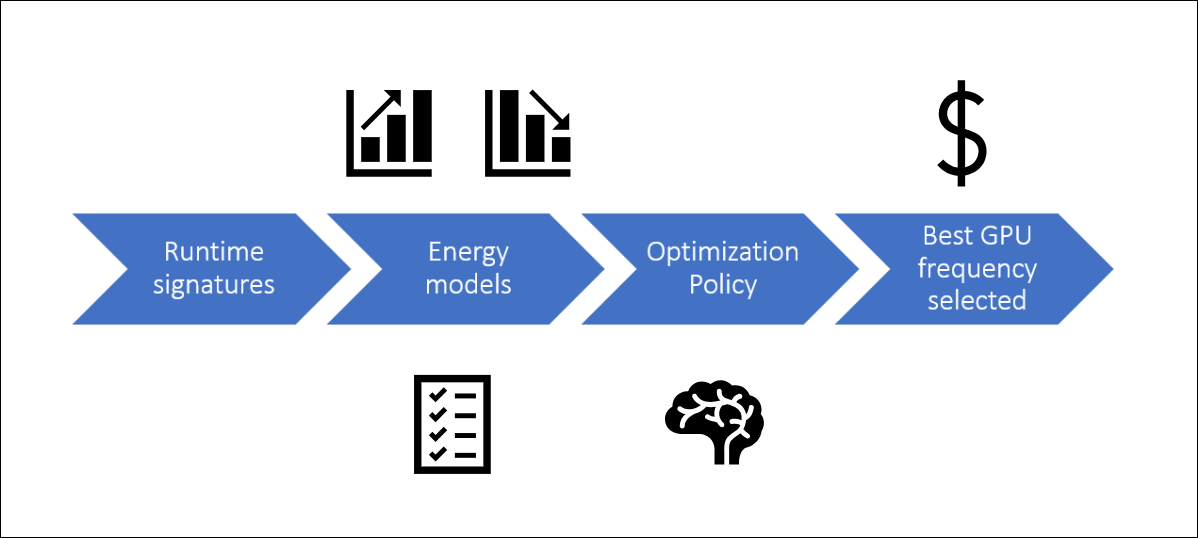
Figure 7. GPU Energy Optimization Process
The following example illustrates how to apply the “GPU Energy Optimization” policy to a well-known HPC application, GROMACS. This example demonstrates how to use EAR with containerized workloads. EAR is fully compatible with container technologies such as Docker, Apptainer, Singularity, and others. To support these scenarios, EAR provides the erun wrapper, a convenient tool that loads EAR into the execution context of the container.
In the example below, GROMACS is installed inside an Apptainer-generated SIF container image, and the erun wrapper is used to load and execute EAR within the container environment.
#!/bin/bash
#SBATCH -J GROMACS
#SBATCH -N 1
#SBATCH --ntasks-per-node=8
#SBATCH --cpus-per-task=16
#SBATCH -p gpu_nvidia
#SBATCH --gres=gpu:4
#SBATCH --ear-policy=optimization
#SBATCH --ear-policy-th=0.10

module use /opt/ear/etc/module
module load ear

export APPTAINER_IMAGE="${SLURM_SUBMIT_DIR}/gromacs_2023.2.sif"

export APPTAINERENV_EAR_INSTALL_PATH=${EAR_INSTALL_PATH}
export APPTAINERENV_EAR_ETC=${EAR_ETC}
export APPTAINERENV_EAR_TMP=${EAR_TMP}

export GMX_ENABLE_DIRECT_GPU_COMM=1

cd ${SLURM_SUBMIT_DIR}/stmv_benchmark
apptainer run --nv \
        --bind ${SLURM_SUBMIT_DIR}:${SLURM_SUBMIT_DIR}:rw \
        --bind ${EAR_INSTALL_PATH}:${EAR_INSTALL_PATH}:ro \
        --bind ${EAR_TMP}:${EAR_TMP}:rw \
        ${APPTAINER_IMAGE} \
        ${EAR_INSTALL_PATH}/bin/erun \
                --program="gmx mdrun –ntmpi 8 <…>"
As shown in Figure below, enabling the EAR Optimizer module for GROMACS results in a substantial reduction in DC node power consumption, while introducing only a 7.58% performance impact. At the same time, the average power consumption decreases by nearly 20%.
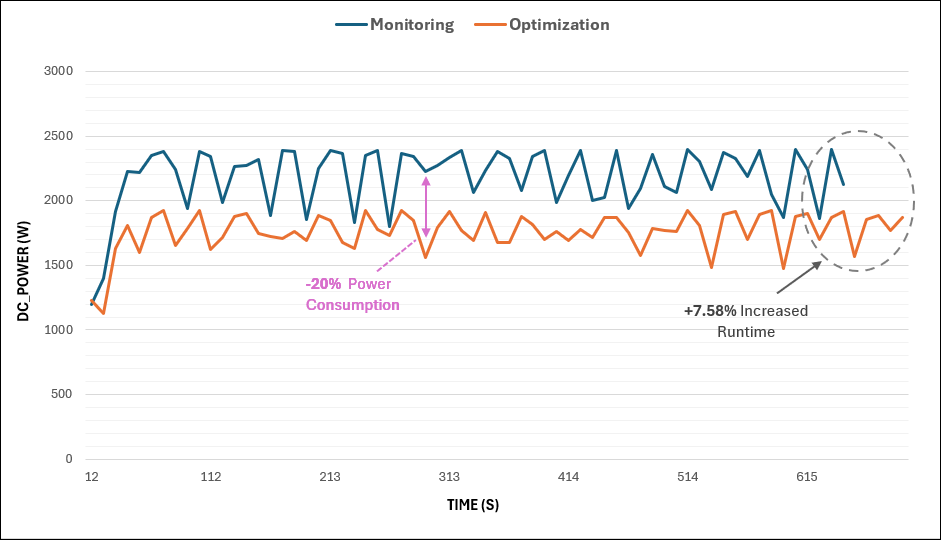
Figure 8. DC Power reduction of GROMACS with EAR
When examining the performance-per-watt ratio in Figure below, we observe an overall energy-efficiency improvement of more than 18%.
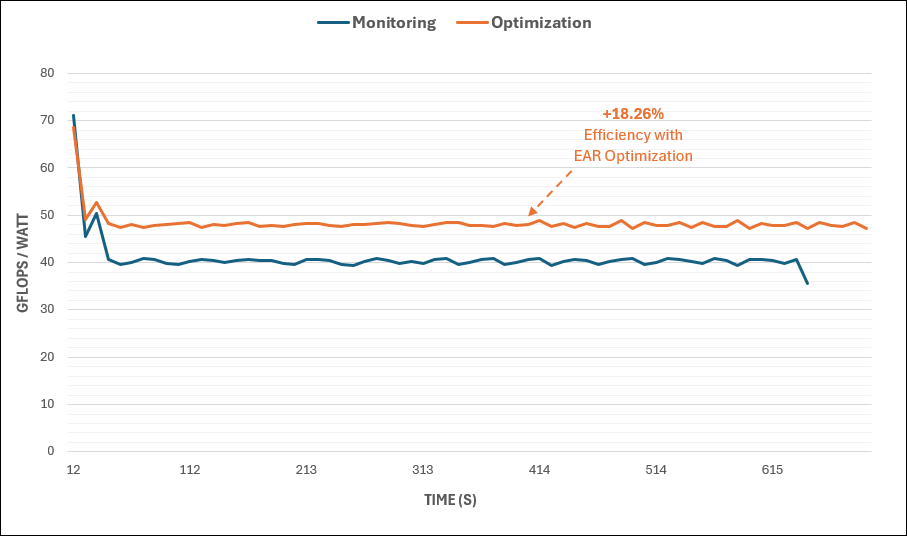
Figure 9. Performance-per-watt optimization of GROMACS with EAR
Advanced Job Visualization Tools
For application-level data visualization, EAR includes the EAR Job Visualization tool [9]. This Python-based utility can generate either timeline images or Paraver1 traces. Paraver traces enable advanced post-processing and in-depth analysis using the Paraver toolchain. The ear-job-visualizer documentation includes Paraver configuration files that can be used directly with EAR- generated traces.
The following example illustrates how to use to generate CSV files that can be used with Paraver. In this case, there is no need to explicitly specify a list of metrics, as the generated trace automatically includes all available metrics.
[user]$ ear-job-visualizer --format ear2prv --job-id 69478 --step-id 0 \
    --loops-file /examples/runtime_format/69478_loops.csv \
    --apps-file /examples/runtime_format/69478_apps.csv
1 https://tools.bsc.es/downloads
The following figures present the visualization of two metrics – GPU power and GPU frequency – for two applications running on the same node: one executed without optimization and the other with dynamic energy optimization enabled. The metrics are represented using a color gradient, where green indicates lower values and blue indicates higher values. Each row in the figures corresponds to a single application. The images were generated using the ear-job-visualizer in combination with Paraver as the visualization tool.
The results clearly demonstrate that both GPU power consumption and GPU frequency are higher in the unoptimized execution compared to the run with dynamic energy optimization enabled.
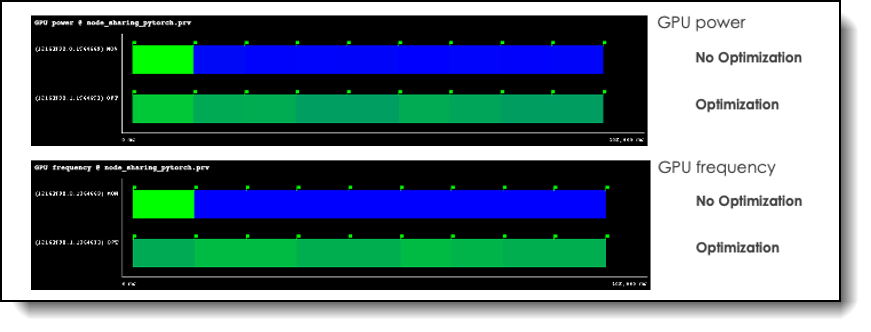
Figure 10. Example of the EAR Job Visualization tool with Paraver traces
The following example illustrates the use of the ear-job-visualization tool with input data generated from CSV files.
[user]$ ear-job-visualizer --format runtime -j 38012103 -s 0 -t gromacs -o gromacs --apps-file gromacs_metrics_as01r3b05_apps.csv --loops-file gromacs_metrics_as01r3b05_loops.csv -m gpu_util gpu_power gpu_memutil gpu_gflops
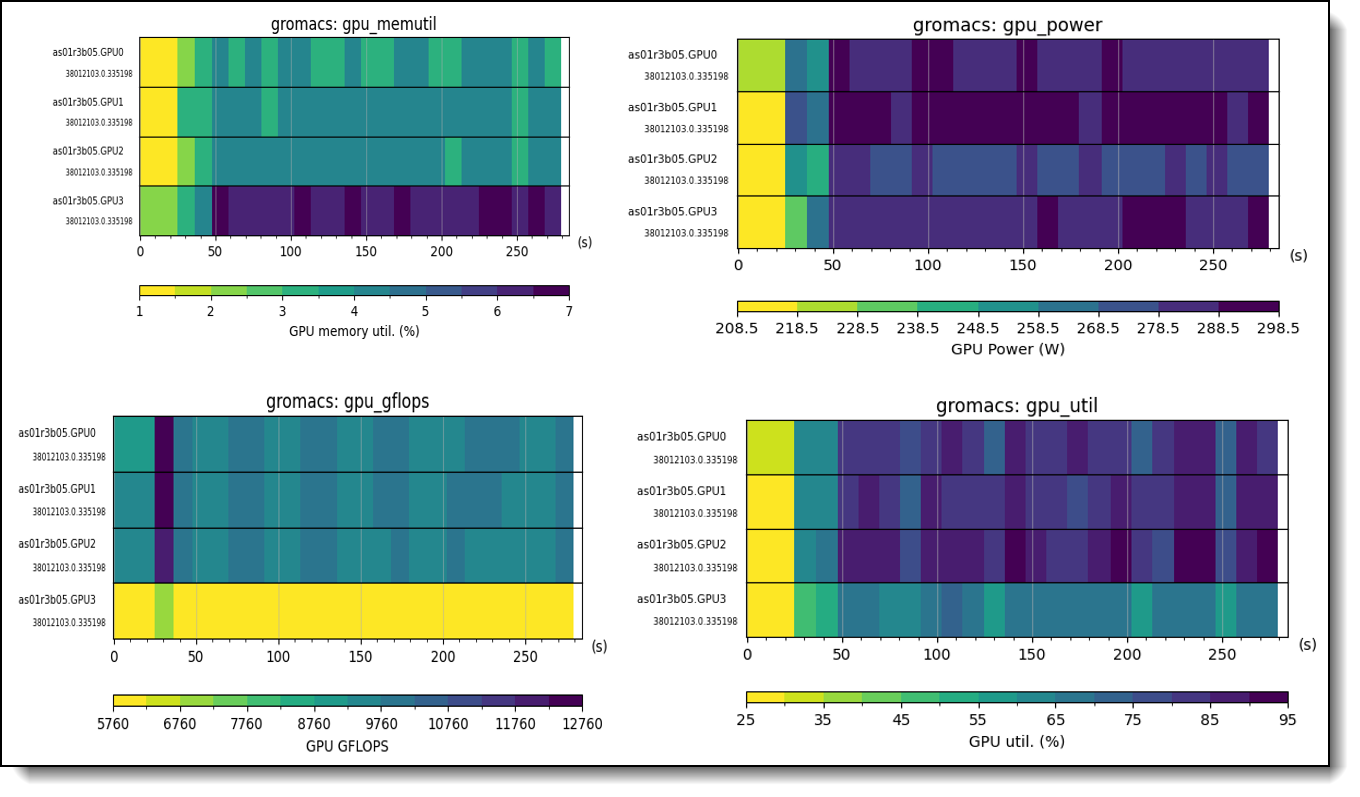
Figure 11. Example of the ear-job-visualization tool using CSV files
Resource Optimization with the EAR Job Analytics
For advanced post-mortem job analysis, EAR provides the EAR Job Analytics tool. This tool enables users to analyze completed jobs and provides hints – actionable insights derived from a job’s execution – that can help improve resource utilization and efficiency in future runs.
EAR Job Analytics combines information collected from two main sources:
- Scheduler data, such as the resources requested by the job
- Performance and power monitoring data collected by EAR during execution
By correlating these data sources, the tool can compare requested versus actual resource usage and, more importantly, relate the observed performance to the resources and energy consumed.
The EAR Job Analytics tool is highly configurable. In addition to a set of default hints, new architecture-specific or application-specific hints can be added. These specific hints can be requested on demand using the --tag=tag_name option when invoking the tool.
The example below illustrates the use of the job analytics workflow with the default hint tags enabled.
- Run the job normally and inspect the accounting data using the eacct command. This use case corresponds to a GROMACS application with GPU support. As highlighted in blue, the GPU utilization is relatively low, indicating that the allocated GPU resources are not fully exploited.
[user]$ eacct -j 1513460 JOB-STEP AID APPLICATION POWER(W) TIME(s) GBS CPI 1513460-0 2812126 gmx 1850 335 20 1.49 ENERGY(KWh) G-POW (T/U) G-FREQ G-UTIL(G/MEM) G-GFLOPS 0.17 1441.78/1441.78 1.956 63%/3% 13047.37 - Request hints from EAR to analyze the job and generate actionable recommendations. The ear-job-analytics tool provides both generic hints and tag-specific hints. In the following example, a specific set of recommendations associated with the gromacs_singularity use case is applied (highlighted in yellow). When selecting tag-specific hints, both the limits and the descriptive guidance become more targeted than those provided by the default hints. In this example, the recommendations explicitly reference GROMACS runtime flags, enabling more precise and application-aware optimization guidance.
I[user]$ ear-job-analytics resource-utilization --job-id 1513460 -r gromacs_singularity Performance issues/hints JobID ┃ StepID ┃ AppID ┃ Node ┃ Metric ┃ Value ┃ Reason ┃ Hint ━━━━━━━━━━━━━━━━━━━━━━━━━━━━━━━━━━━━━━━━━━━━━━━━━━━━━━━━━━━━━━━━━━━━━━━━━━━━━━━━━━━━━1513460 │ 0 │ 2812126 │ spr4271 │ GPU0_UTIL_PERC │ 74 │ GPU infra-used │ Increase the number of processes/threads (-ntmpi / -ntomp) or reduce the number of GPUs allocated. - Apply the suggested hints and re-run the job using the recommended configuration settings.
[user]$ ${APPTAINER} $EAR_INSTALL_PATH/bin/erun \ --ear-policy=monitoring \ --program="gmx mdrun \ -ntmpi 16 -ntomp 8 \ -nb gpu -pme gpu -npme 1 -update gpu \ -bonded gpu -nsteps 200000 -resetstep 90000 \ -noconfout -dlb no -nstlist 300 -pin on -v -gpu_id 0123" - Re-run the job and compare both executions using the eacct command to evaluate the impact of the applied optimizations. As shown in this example, applying the recommended hints results in a reduced runtime and an increase in GPU utilization from 63% to 73%, indicating more efficient use of GPU resources on the node.
[user]$ eacct -j 1513461
 JOB-STEP     AID        APPLICATION    POWER(W) TIME(s)    GBS     CPI
1513468-0    2817527    gmx              2093    294        35      1.53

ENERGY(KWh)    G-POW (T/U)     G-FREQ     G-UTIL(G/MEM)  G-GFLOPS
  0.17         1618.34/1618.34 1.962       73%/4%        15126.92
Kubernetes Use Case: POD Specification and Submission
Support for EAR in Kubernetes (K8s) is provided through the installation of a webhook, which automatically mounts the EAR directory into the Pod and sets the required environment variables to load the EAR environment, as illustrated in the Figure below.
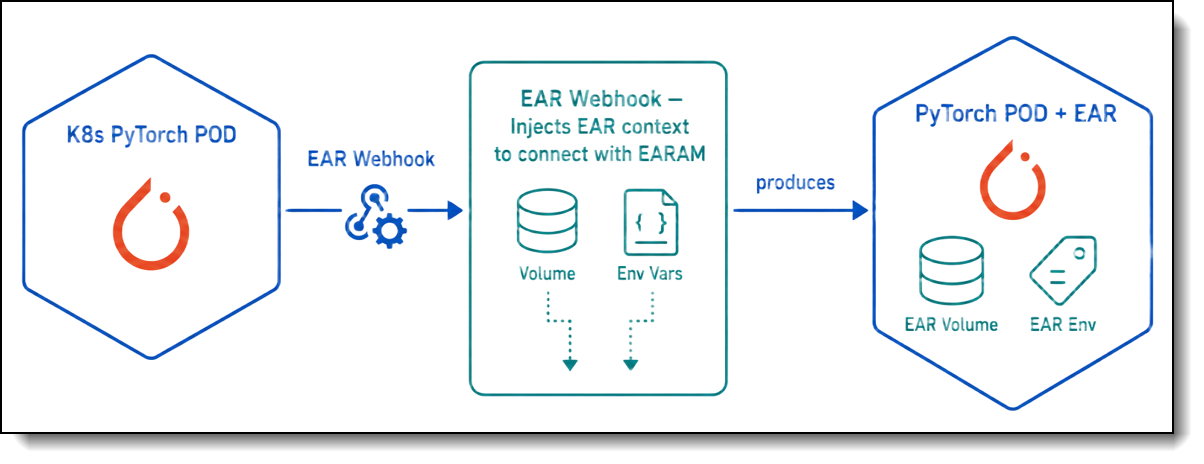
The following code shows the pytorch_with_ear.yaml file used to run a PyTorch workload on a Kubernetes cluster, requesting one CPU and one GPU.
apiVersion: v1
kind: Pod
metadata:
  name: pytorch-earauto
spec:
  restartPolicy: Never
  containers:
  - name: pytorch
    image: nvcr.io/nvidia/pytorch:24.06-py3
    resources:
      requests:
        cpu: 1
        nvidia.com/gpu: "1"
      limits:
        cpu: 1
        nvidia.com/gpu: "1"
    volumeMounts:
    env:
    - name: MY_POD_UID
      valueFrom:
        fieldRef:
          fieldPath: metadata.uid
    - name: MY_POD_NAME
      valueFrom:
        fieldRef:
          fieldPath: metadata.name
    - name: MY_POD_NAMESPACE
      valueFrom:
        fieldRef:
          fieldPath: metadata.namespace
    command:
    - python
    - /opt/pytorch/examples/upstream/word_language_model/main.py
    - --cuda
    - --epochs
    - "20"
    - --data
    - /opt/pytorch/examples/upstream/word_language_model/data/wikitext-2
    - --save
    - model.pt
This workload is executed with EAR enabled using the following commands.
[user]$ kubectl apply –f pytorch_with_ear.yaml
[user]$ kubectl get pods
NAME          READY   STATUS      RESTARTS   AGE
pytorch-ear   1/1     Running     0          59s
The EAR webhook updates the Pod context by mounting the required EAR paths and setting the necessary environment variables to enable EAR integration with PyTorch. The following command illustrates the main modifications introduced by the EAR webhook2.
user]$ kubectl describe pod pytorch-earauto
Name:             pytorch-earauto
Containers:
  pytorch:
    Container ID:  containerd://035962cc21a91840c6b8c8d0b811d7c4c05070fb4feaedc7d00aefb957c5e292
    Image:         nvcr.io/nvidia/pytorch:24.06-py3
    Image ID:      nvcr.io/nvidia/pytorch@sha256:d2e356ae415541b0088ea8a6883a9c620a411974a451b7e368ce88dff2a74f6c
    Command:
      python
      /opt/pytorch/examples/upstream/word_language_model/main.py
    Environment:
      MY_POD_UID:          (v1:metadata.uid)
      MY_POD_NAME:        pytorch-earauto (v1:metadata.name)
      MY_POD_NAMESPACE:   default (v1:metadata.namespace)
      EAR_INSTALL_PATH:   /opt/ear
      LD_PRELOAD:         /opt/ear/lib/libearld.aas.so
      EAR_TMP:            /var/ear
    Mounts:
      /opt/ear from volume-ear-install-path (rw)
      /var/ear from volume-ear-tmp (rw)
      /var/run/secrets/kubernetes.io/serviceaccount from kube-api-access-rwwcv (ro)
  volume-ear-install-path:
    Type:          HostPath (bare host directory volume)
    Path:          /opt/ear
    HostPathType:  DirectoryOrCreate
  volume-ear-tmp:
    Type:          HostPath (bare host directory volume)
    Path:          /var/ear
    HostPathType:  DirectoryOrCreate
2 For readability, most of the command output has been omitted, as it is lengthy and not relevant to this paper.
The following output shows the eacct output when using the -F option to select specific columns for visualization. In this particular case, the selected fields include the K8s UUID and GPU performance metrics.
[user]:~/Pytorch$ eacct -j 1009 –r -F jxtpS
   UUID                                      JOB-STEP AID        TIME(s)    POWER(W)
G-POW (T/U)     G-FREQ   G-UTIL(G/MEM) G-GFLOPS  GR_ENGINE  SM_ACT(%)  SM_OCC(%)
TENSOR(%)  DRAM(%)    FP64(%)    FP32(%)    FP16(%)    PCIE_TX    PCIE_RX    NVLINK_TX
NVLINK_RX
460f670f-bebd-493f-bbd5-4feeb1f1d032  1778214-0    365247     304        820        402.64
/402.64  1.980      98%/64%     7173.33   89.7       74.5       37.3       5.6
49.9       0.0        1.6        1.9        8          47         0          0
System Administrator and Data Center Manager Perspective on EAR usage
- System Monitoring and Data Visualization
- Resource and Energy Optimization with the EAR System Analytics
System administrators and data center managers can benefit from EAR through several key features:
- System monitoring and data visualization
- Smart Power Cap
- Anomaly detection and reporting
- Energy accounting
- Heterogeneous cluster support with single installation
- Analysis of resource utilization
- Hints for energy optimization and improved resource utilization
System Monitoring and Data Visualization
EAR services implement both node-level and cluster-level power monitoring:
- Node monitoring includes DC node power, CPU, DRAM, and GPU power, temperature, and average CPU frequency, collected at fixed intervals specified in the EAR configuration file.
- Cluster monitoring includes power reporting for groups of nodes, also at fixed intervals defined in the configuration file.
Node- and cluster-level monitoring data can be visualized using Grafana dashboards, as shown in Figure below.
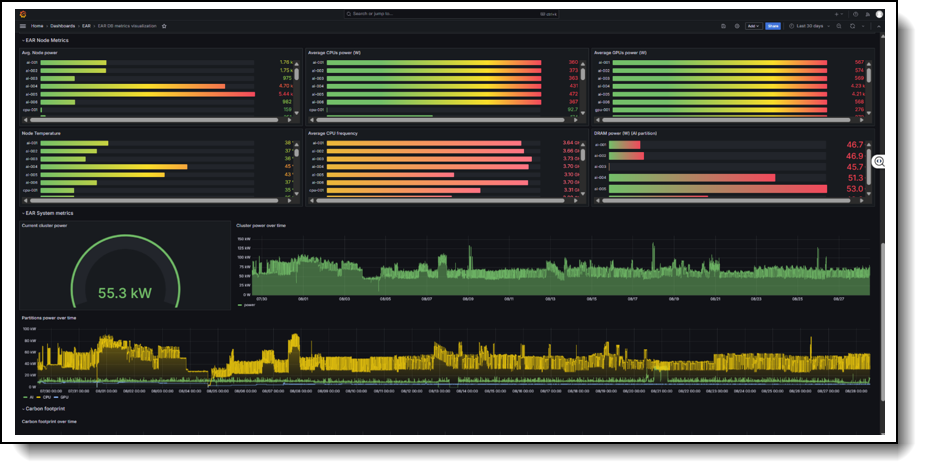
Figure 13. Example of Grafana dashboards
Based on the periodic metrics collected, EAR generates alerts for two specific parameters: DC node power and CPU temperature. In the current version, the actions associated with this anomaly detection are fixed and include generating a message in the system log and creating an event in the EAR database. These notifications can subsequently be used to trigger additional actions through existing log-parsing mechanisms or database event-tracking workflows.
Based on the information available in the database, EAR provides a dedicated command for system-level energy reporting. The ereport command generates energy reports using a variety of filters, such as per user, per group, per time interval, per node, or per group of nodes. These reports can be used both for statistical analysis, for example, evaluating the average power consumption of compute nodes or identifying anomalies, and for accounting purposes, such as per-user or per-group energy consumption.
Modern HPC and AI clusters are designed to support a wide range of workload types, from CPU-only applications to AI and accelerator-based use cases. As a result, it is common to deploy multiple partitions with distinct hardware characteristics, such as CPU-only nodes, GPU-accelerated nodes, or CPU nodes with increased memory capacity.
EAR natively supports these heterogeneous configurations through the concept of tags defined in the configuration file. A tag represents a specific node type and allows system administrators to define, for example, default policies per partition, energy-measurement plugins, or power capping values. Additional configuration options, such as grouping nodes under the same cluster power manager with individual power limits, or defining node groups for data reporting, can also be specified within a single configuration file.
This level of configurability makes the deployment and operation of EAR in heterogeneous clusters simple and flexible.
Smart Power Cap
EAR Smart Power Cap is based on the principle of dynamically allocating a larger share of the available power budget to energy-efficient applications, while ensuring that global power constraints are strictly respected. This approach enables systems to maximize overall throughput under fixed power limits.
The EARGM (EAR Global Manager) is the component responsible for power and energy management at the cluster or sub-cluster level. It oversees power allocation decisions based on system-wide visibility and enforces the defined power policies across the managed resources.
The EAR Power Cap architecture is designed to be both scalable and extensible, making it suitable for large and heterogeneous HPC and AI clusters. As illustrated in the figure below, the architecture follows a hierarchical model. At the top level, a Meta-EARGM coordinates multlple EARGMs. Each EARGM manages a group of compute nodes, and each node independently enforces power limits either at the CPU level or across the combined CPU and GPU domains, depending on the node configuration.
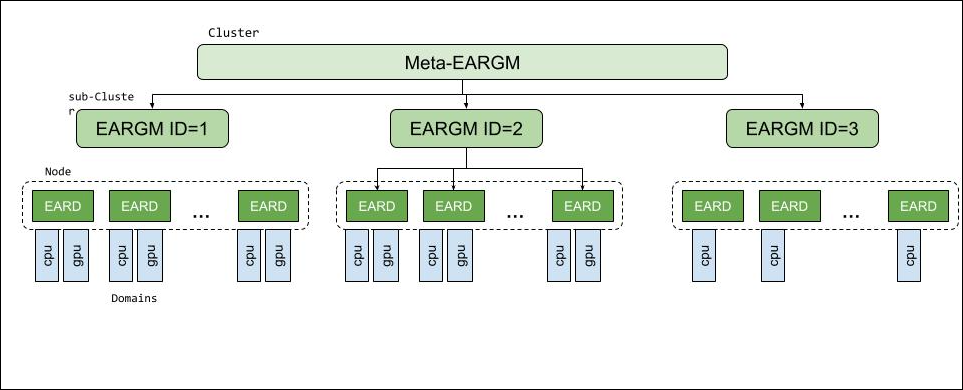
Figure 14. EAR Smart Power Cap architecture overview
The number and configuration of EARGMs depend on the overall cluster size and the selected power capping strategy. This flexibility allows the architecture to scale from small deployments to large, heterogeneous HPC and AI systems.
Each level of the architecture is responsible for implementing a common set of core functions:
- Power Cap Control: Ensures that actual power consumption remains within the allocated power budget and triggers corrective actions when violations occur.
- Power Cap Status Reporting: Continuously evaluates current power demand against the assigned power budget and propagates this information to higher layers of the hierarchy.
- Power Cap API: Exposes an API that allow upper layers to query status information and interact with the underlying power capping mechanisms.
- Power Balancing: Dynamically redistribute available power when multiple subdomains are managed, enabling efficient utilization of the global power budget.
At every level of the hierarchy, power management follows a continuous optimization loop that combines real-time power monitoring with intelligent power-balancing decisions. This feedback-driven approach allows EAR to adapt dynamically to changing workload characteristics while maintaining compliance with system-wide power constraints.
The responsibilities of the individual architectural components are defined as follows:
- Meta-EARGM: Periodically collects power-status information from the set of EARGMs under its control and redistributes power budgets among them when required.
- EARGM: Periodically gathers power-status information from the compute nodes it manages and reallocates power based on the current power distribution and node activity. At this level, two power capping policies are supported: soft and hard [13], allowing administrators to choose between flexible throttling and strict enforcement depending on operational requirements.
- EARD: Continuously monitors node-level power consumption across its main power domains, including CPUs and GPUs. It dynamically estimates the contribution of each domain to the total node power and enforces the assigned power budget accordingly. EARD also takes into account energy-efficiency hints provided by EARAM to determine the node’s power status.
Soft vs. Hard Power Capping
With the soft power capping policy, power limits are applied dynamically and only when power consumption exceeds the defined cluster power budget. This approach is particularly well suited for environments where maintaining an average power envelope is important, while short-lived power peaks remain acceptable. As a result, applications can run unrestricted most of the time, with power capping activated only when required to keep overall energy usage within the desired range. This maximizes performance while still ensuring compliance with facility power constraints.
By contrast, the hard power capping policy continuously enforces predefined node-level power limits, regardless of the cluster's current power consumption. This ensures that the cluster never exceeds its allocated power budget, providing the highest level of predictability and control over power usage. While this traditional approach offers stronger power guarantees, it may also impose more frequent performance limitations on workloads, as power restrictions remain active at all times.
Smart Power Cap Evaluation
This section demonstrates the value of EAR Smart Power Cap when running workloads in a power-constrained cluster. The evaluation was conducted using the EAR ClusterSim framework described in [13]. The simulated environment consists of four NVL72 GB200 racks with a total of 288 NVIDIA B200 GPUs (GPU TDP: 1000 W; CPU TDP: 700W).
The workload simulates the execution of 1984 jobs, representing approximately four days of cluster activity. It includes two types of jobs: medium-power workloads, characterized using DGEMM signatures, and high-power workloads, characterized by FP16 training workloads. The workload mix is evenly distributed, with each job type accounting for 50% of the total workload. The average requested power is 650W for DGEMM jobs and 1262W for FP16 training jobs.
Four configurations were evaluated:
- No power limit (included only to illustrate the requested power demand).
- Static Power Cap.
- Smart Power Cap (SPC).
- Smart Power Cap (SPC) + Optimizer.
For all power-capped configurations, the cluster power limit was set to 243.2 kW.
The difference between SPC and SPC+Optimizer lies in the selected GPU frequency. With SPC, GPUs operate at the maximum available frequency, whereas with SPC+Optimizer, the operating frequency is dynamically determined by the EAR Optimizer to maximize energy efficiency while respecting the cluster power budget.
The figure below illustrates the impact of the different power management strategies on workload execution time and cluster power consumption. The Uncapped scenario (purple line) shows the power demand requested by the workload, which varies over time according to the mix of running jobs.
As shown in the figure, both EAR strategies, SPC and SPC+Optimizer, are able to fully utilize the available cluster power budget, resulting in more efficient workload execution than a static power cap approach. In contrast, the static power cap distributes power uniformly across the system and does not account for workload variability or the specific power requirements of individual jobs. As a result, it leaves available power underutilized and increases overall workload execution time.
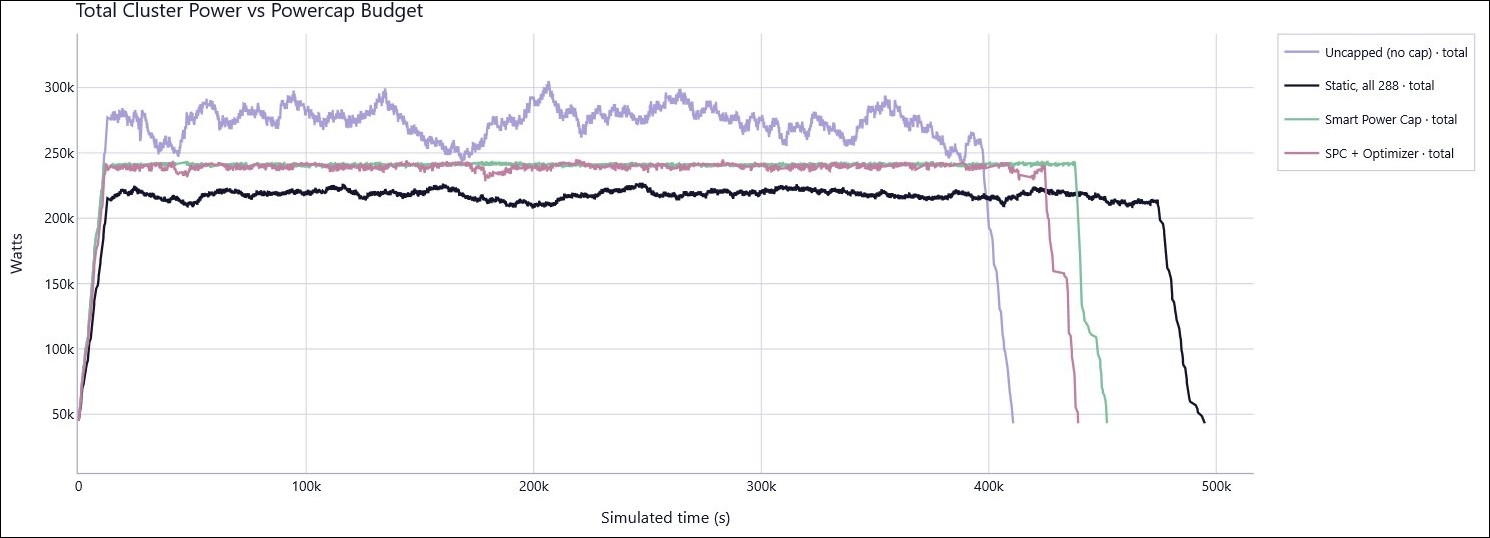
Figure 15. Smart Power Cap dynamically redistributes power to keep cluster consumption below the configured power limit while maximizing utilization of the available power budget.
The figure that follows highlights the impact of EAR on key performance metrics compared with a static power cap approach. These results help explain the reduction in workload walltime observed in the previous figure.
As shown, EAR delivers a significant reduction in average job runtime, decreasing execution time by 8% with SPC and by 10% with SPC+Optimizer. Faster job execution directly translates into lower job queue times and higher overall cluster throughput.
For this workload, the average job wait time was reduced by 32% with SPC and by 42% with SPC+Optimizer. At the same time, system throughput increased by 10% and 12.6%, respectively. These improvements demonstrate how EAR can enhance overall cluster efficiency by optimizing power allocation while maintaining operation within the defined power budget.
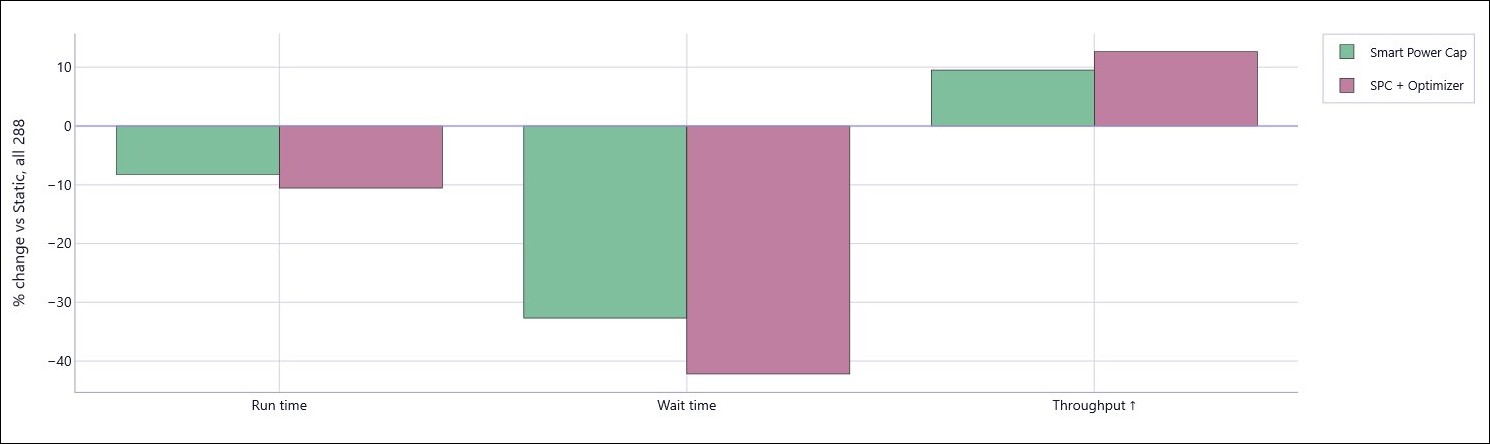
Figure 16. EAR improves cluster efficiency through faster job execution.
The figure below provides deeper insight into the reasons behind the improvements in runtime, wait time, and throughput observed with EAR. The figure compares the average application slowdown for each workload class across the three power-capped scenarios relative to the uncapped configuration.
As DGEMM workloads require less power than the static power limit, they experience little to no performance degradation under the static power cap strategy. In contrast, high-power FP16 training workloads require significantly more power than the static allocation allows, resulting in an average runtime increase of up to 40%.
Both EAR strategies achieve a much closer alignment between the power requested by applications and the power actually allocated to them. This effect is particularly evident with SPC+Optimizer. By allocating high-power workloads their energy-optimal operating point rather than the maximum possible power, the optimizer frees additional power that can be reassigned to DGEMM workloads. As a result, overall power distribution across the cluster is more balanced, reducing performance degradation compared with SPC alone while maintaining compliance with the cluster power budget.
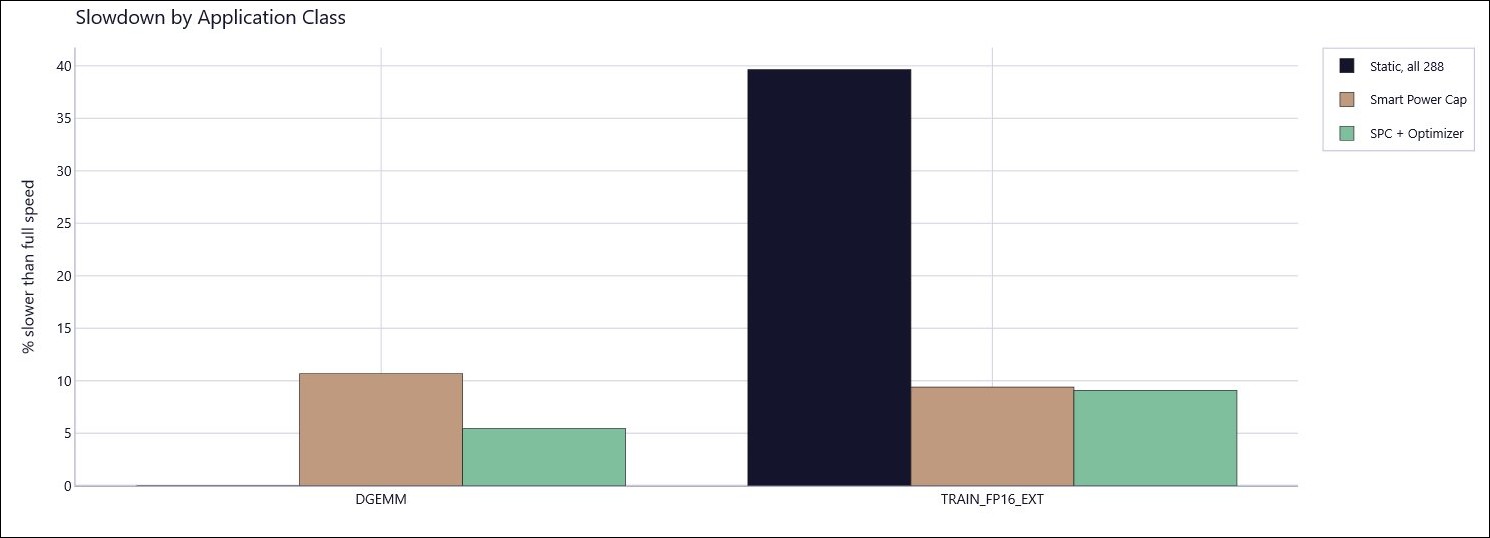
Figure 17. Impact of power allocation strategies on application performance.
Smart Power Cap command: econtrol
This section describes the econtrol command, which allows system administrators to configure and manage the Smart Power Cap functionality in EAR.
The complete econtrol command reference is available in the EAR documentation wiki3.
Status and Monitoring Commands:
- econtrol --status --type=power
Queries the power capping status for the entire cluster. The ouput includes aggregated node power consumption, configured power capping limits, power capping enablement status, idle nodes, releasable power, and nodes operating in greedy mode. - econtrol --status --type=power --hosts node1[,node2..noden]
Queries the power capping configuration for the specified nodes. - econtrol --status --type=power --domain eargmid:2
Queries the power capping configuration for all nodes controlled by the specified EARGM instance (e.g., eargmid 2). - econtrol –power
Returns the aggregated instantaneous power consumption of the entire cluster. - econtrol --power --hosts=nodename1,nodename2,...nodenameN
Computes and aggregates the instantaneous power consumption of the specified nodes. - econtrol --power --domain island:0
Returns the aggregated power consumption of all compute nodes belonging to the specified island (e.g., island 0).
Configuration Commands:
- econtrol --set-powercap NEW_LIMIT --domain tag:cpu_only
Sets a new power capping limit (NEW_LIMIT) for all nodes associated with the specified tag, as defined in the EAR configuration file (ear.conf), independently of island or other configuration. - econtrol --set-powercap NEW_LIMIT --hosts=eargm_nodename --type=eargm
Sets a new power capping limit to the specified EARGM instance. - econtrol --set-powercap NEW_LIMIT --hosts=eargm_nodename:port --type=eargm
Sets a new power capping limit to a specified EARGM instance identified by a given port.
3 https://gitlab.bsc.es/ear_team/ear/-/wikis/EAR-commands#ear-control-econtrol
Resource and Energy Optimization with the EAR System Analytics
Given the rich set of contextualized data available in the EAR database, which goes beyond traditional system monitoring by associating metrics with workload, user, and system semantics, EAR includes the EAR System Analytics tool (ear-system-analytics). Unlike basic monitoring solutions, where metrics often lack operational context, this tool provides higher-level insights derived from both job-level and system-level accounting data.
The EAR System Analytics tool follows a philosophy similar to that of ear-job-analytics, but operates from a global workload perspective. It analyzes all relevant metrics collected over a specified time period (i.e., job and system accounting).
The main goals and features of ear-system-analytics include:
- Generate workload statistics for data center management and accounting.
- Generate workload reports with job characterization, enabling better system understanding and configuration. For example, adapting policies and limits based on job typologies, and updating future procurements using real, current workload information.
- Generate system statistics and reports (PDF documents) for data center utilization evaluation. These reports can be used to justify the data center utilization with the DC managers and institutions.
- Energy optimization reports and hints. For example, energy savings calculations and estimates of potential energy savings under different policies and thresholds when optimization is not enabled by default.
- Hints for improving resource utilization. The tool identifies the most relevant users and jobs and automatically applies the ear-job-analytic feature to generate optimization insights. The output is a set of recommendations to improve resource utilization and application performance for the most time-consuming jobs and users.
The following output illustrates a subset of the information generated by the ear-system-analytics tool in the command line, showing the analyzed cluster, the selected reporting period, and key accounting metrics. Data has been synthetically generated, but it is representative of a small cluster, and the analyzed period has been 1 month. Parts of the output have been selected to show how the resource utilization is presented, the energy savings and the performance hints.
Resource Utilization Analysis
The command-line interface provides a statistical summary of cluster activity for the selected period, including key metrics such as total energy consumption and estimated CO2 emissions, which can be used to support regulatory reporting and sustainability initiatives. One of EAR’s key differentiators compared with other solutions is its ability to correlate both hardware-level and workload-level data, giving system administrators and data center managers access to all relevant information through a single command.
This initial overview also highlights strategic metrics, including the most power-intensive users, applications, and user groups. By analyzing the reported percentages, administrators can quickly assess where energy consumption is concentrated and determine whether further investigation or optimization efforts should be prioritized for specific users, applications, or groups.
admin@ear-tools:$ ear-sys-analytics run -s 01-04-2026 -e 01-05-2026
╭──────────────────────────────╮
│ EAR System Analytics Summary │
╰──────────────────────────────╯
Cluster           DEMO
Reporting period  01-04-2026 → 01-05-2026
PUE               1.3
Carbon Intensity  174.0 gCO₂eq/kWh

INFO Running queries and loading data from EAR70 DB ...

Resource Consumption
                              Total Daily Node Power
┏━━━━━━━━━┳━━━━━━━━━━━━━━━━━━━━━━┳━━━━━━━━━━━━━━━━━━━━━━┳━━━━━━━━━━━━━━━━━━━━━━━━━┓
┃ Average ┃       Minimum (date) ┃       Maximum (date) ┃ Max vs Cluster Capacity ┃
┡━━━━━━━━━╇━━━━━━━━━━━━━━━━━━━━━━╇━━━━━━━━━━━━━━━━━━━━━━╇━━━━━━━━━━━━━━━━━━━━━━━━━┩
│ 1.63 kW │ 1.38 kW (08-04-2026) │ 1.90 kW (15-04-2026) │                 80.46 % │
└─────────┴──────────────────────┴──────────────────────┴─────────────────────────┘

Energy accounting
Peak Consumed Energy:    13.84 kWh (15-04-2026)
Total Consumed Energy:   298.09 kWh
Total Carbon Footprint:  67.43 kg CO₂eq

Top 5 users by High Energy Consumption
┏━━━━━━━━┳━━━━━━━━━━━━━━┳━━━━━━━━━━━━┓
┃ USERID ┃ Energy (kWh) ┃ % of Total ┃
┡━━━━━━━━╇━━━━━━━━━━━━━━╇━━━━━━━━━━━━┩
│ user-1 │       125.78 │    42.19 % │
│ user-2 │       110.01 │    36.91 % │
│ user-3 │        24.30 │     8.15 % │
│ user-8 │        19.38 │     6.50 % │
│ user-5 │         9.23 │     3.10 % │
└────────┴──────────────┴────────────┘

Top 5 applications by High Energy Consumption
┏━━━━━━━━━━━━━━━━┳━━━━━━━━━━━━━━┳━━━━━━━━━━━━┓
┃ JOBNAME        ┃ Energy (kWh) ┃ % of Total ┃
┡━━━━━━━━━━━━━━━━╇━━━━━━━━━━━━━━╇━━━━━━━━━━━━┩
│ gromacs-gpu    │       225.67 │    75.71 % │
│ namd-md        │        17.51 │     5.87 % │
│ python-datajob │        17.47 │     5.86 % │
│ gromacs-mpi    │        16.91 │     5.67 % │
│ hpl-benchmark  │         8.94 │     3.00 % │
└────────────────┴──────────────┴────────────┘
Top 3 groups by High Energy Consumption
┏━━━━━━━━━━━━━┳━━━━━━━━━━━━━━┳━━━━━━━━━━━━┓
┃ GROUPID     ┃ Energy (kWh) ┃ % of Total ┃
┡━━━━━━━━━━━━━╇━━━━━━━━━━━━━━╇━━━━━━━━━━━━┩
│ group-md    │       260.09 │    87.25 % │
│ group-ml    │        24.22 │     8.13 % │
│ group-bench │         9.68 │     3.25 % │
└─────────────┴──────────────┴────────────┘
Performance Recommendations to Improve System Utilization
This is precisely what the tool does: it automatically identifies the most relevant users and performs a deeper analysis using job analytics. The next figure illustrates the recommendations generated automatically when performance issues are detected.
The objective is to help system administrators identify inefficient system usage patterns and take corrective actions. For each selected user, the tool highlights issues such as low GPU utilization, assesses their severity based on the percentage of the user’s jobs affected, and provides tailored recommendations to improve resource utilization.
Because the analysis focuses on users with the greatest impact on cluster resources, improving their workload efficiency can deliver significant benefits at the system level, including better resource utilization and increased overall cluster throughput.
┏━━━━━━━━━┳━━━━━━━━━━━━━━━━━━━━━━━━━━━┳━━━━━━━━━━━━━━━━━━━━┳━━━━━━━━━━━━━━━━━━━━━━━━━━━━━━━━━━━━┓

┃ User ID ┃ Performance Insight       ┃ % of Affected runs ┃ Recommendations                    ┃

┃         ┃                           ┃                    ┃                                    ┃

┡━━━━━━━━━╇━━━━━━━━━━━━━━━━━━━━━━━━━━━╇━━━━━━━━━━━━━━━━━━━━╇━━━━━━━━━━━━━━━━━━━━━━━━━━━━━━━━━━━━┩

│ user-1  │ GPU infra-used            │ 40.5%              │ Consider increasing the problem    │

│         │                           │                    │ size or reduce resource allocation.│

│ user-1  │ Low DRAM activity         │ 100.0%             │ Low DRAM activity detected. This   │

│         │                           │                    │ might indicate low GPU utilization │

│         │                           │                    │ or that...                         │

│ user-2  │ GPU infra-used            │ 22.42%             │ Consider increasing the problem    │

│         │                           │                    │ size or reduce resource allocation.│

│ user-2  │ Low DRAM activity         │ 57.58%             │ Low DRAM activity detected. This   │

│         │                           │                    │ might indicate low GPU utilization │

│         │                           │                    │ or that...                         │

│ user-2  │ Low package power         │ 42.42%             │ Low package power detected on an   │

│         │                           │                    │ Intel CPU-only node. Review your...│

│ user-3  │ GPU infra-used            │ 20.34%             │ Consider increasing the problem    │

│         │                           │                    │ size or reduce resource allocation.│

│ user-3  │ GPU not used              │ 20.34%             │ Error in resource allocation or    │

│         │                           │                    │ application not using GPU.         │

│         │                           │                    │ Check your...                      │

└━━━━━━━━━┴━━━━━━━━━━━━━━━━━━━━━━━━━━━┴━━━━━━━━━━━━━━━━━━━━┴━━━━━━━━━━━━━━━━━━━━━━━━━━━━━━━━━━━━┘
Energy Savings: Reporting and Recommendations
The tool also quantifies the energy savings achieved through the EAR Optimizer. For customers using EAR in monitoring-only mode, it can estimate the potential energy savings, both in absolute terms and as a percentage, that could be achieved if the EAR Optimizer were enabled.
This information is particularly valuable for data center operators because it is not based on generic models or assumptions. Instead, the estimates are derived from the customer’s actual workload characteristics and execution patterns. As a result, decisions regarding the adoption of energy optimization policies can be made using data that accurately reflects the customer’s environment and operational requirements.
Energy Savings estimations
Potential energy saving if GPU monitoring runs were under an optimization policy
               Results for high-energy users (≥ 5 % total energy)
┏━━━━━━━━━━━━━┳━━━━━━━━━━━━━━━━━━━┳━━━━━━━━━━━━━━━━━━━━━━━━━━━━━━━━┳━━━━━━━━━━━┓
┃ Threshold % ┃ Energy used (kWh) ┃ Potential Energy to save (kWh) ┃ Savings % ┃
┡━━━━━━━━━━━━━╇━━━━━━━━━━━━━━━━━━━╇━━━━━━━━━━━━━━━━━━━━━━━━━━━━━━━━╇━━━━━━━━━━━┩
│ 5.0         │             56.92 │                           6.04 │     10.61 │
│ 10.0        │             56.92 │                           9.22 │     16.20 │
└─────────────┴───────────────────┴────────────────────────────────┴───────────┘
Conclusions and Outlook
The rapid rise in power density and energy consumption across modern HPC and AI infrastructures has made energy efficiency and power‑aware operation essential pillars of sustainable data‑center management. As this paper has shown, the Energy Aware Runtime (EAR) provides a comprehensive and mature solution to these challenges by combining real‑time monitoring, dynamic energy optimization, advanced analytics with hints for better resource utilization, and intelligent power capping mechanisms.
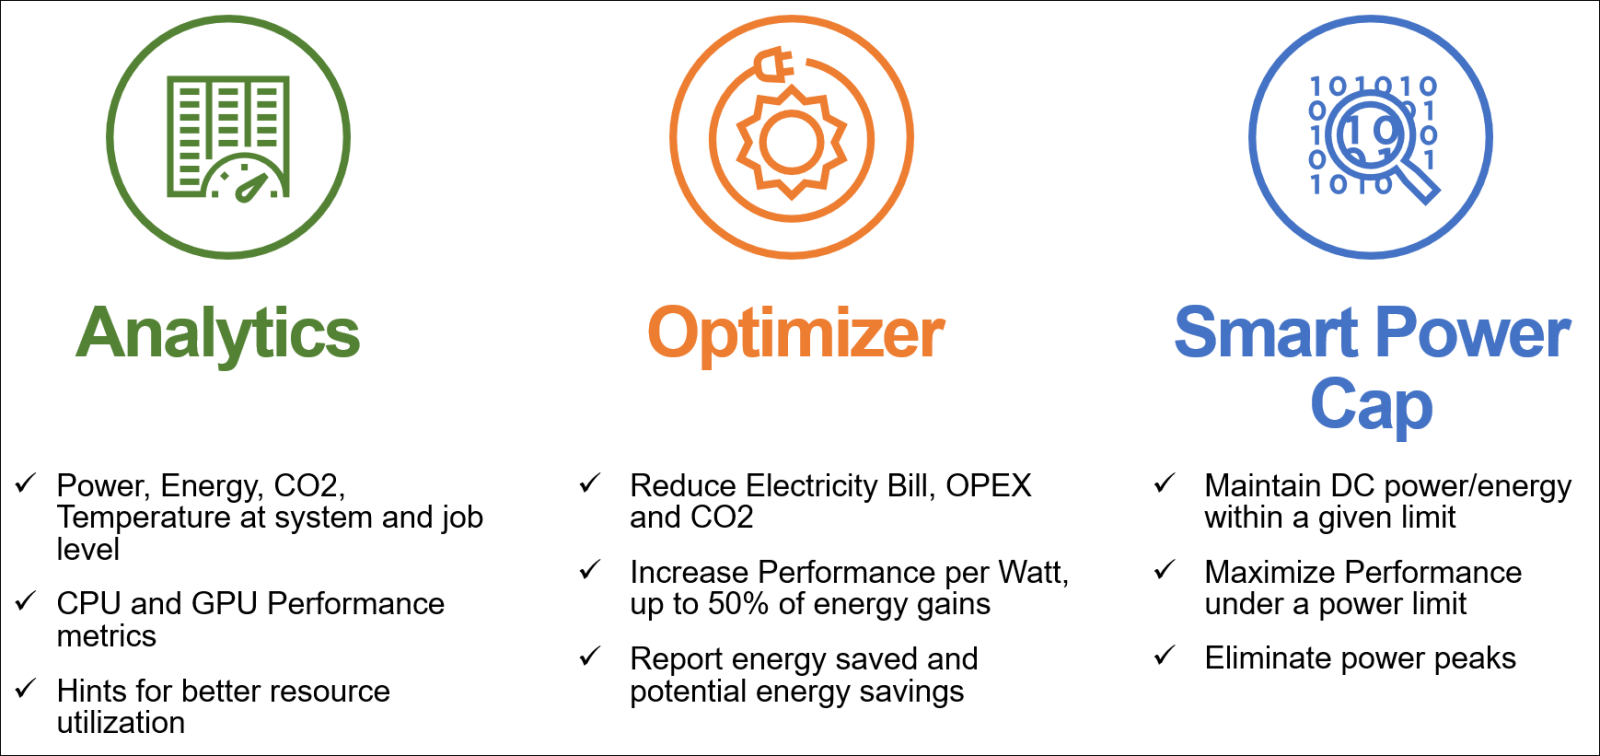
Figure 18. Analytics, Optimizer and Smart Power Cap.
EAR enables HPC and AI facilities to:
- Improve energy efficiency through adaptive GPU optimization without compromising performance more than defined by policy thresholds.
- Increase system throughput under power limits using Smart Power Cap to balance electrical power across nodes and jobs to reach the highest efficiency.
- Increase system effectiveness and operational visibility via monitoring, accounting and the system analytics tool integrated with Grafana.
- Enhance user productivity through intuitive insights from the job analytics tool and profiling capabilities that require no code modifications.
- Support administrators and data‑center managers with automated workflows, actionable recommendations, and the ability to enforce energy‑aware policies at scale.
As GPU power consumption continues to increase and data centers are becoming power limited, traditional approaches centered solely on pure performance are no longer sufficient. HPC and AI systems now require energy-aware orchestration by design. EAR is already aligned with this shift, offering scalable architecture and extensible features that enable sustained improvements in performance per watt across upcoming heterogeneous platforms, evolving workload mixes, and increasingly dynamic power environments.
With the last EAR release, EAR is easier to use and simple to install. With the Trial version, customers can test EAR on their system and their applications. This capability makes it easy for customers to determine whether EAR meets their requirements, before they buy the full version.
Looking ahead, further development of EAR—driven by continued collaboration between Lenovo, Energy Aware Solutions (EAS), and the broader HPC and AI community—will deliver even richer analytics, expanded optimizer capabilities, and new ways to deliver more performance per watt. Together, these advancements will help ensure that HPC and AI data centers can continue to grow sustainably, delivering maximum performance within managed power and operational boundaries.
EAR therefore stands as a key enabler for next‑generation, energy‑efficient computing—empowering users, administrators, and data‑center operators to unlock the full value of their infrastructure while meeting modern efficiency and sustainability goals.
Resources
For more information, see these resources:
- [1] Auweter, A. et al. (2014). A Case Study of Energy Aware Scheduling on SuperMUC. In: Kunkel, J.M., Ludwig, T., Meuer, H.W. (eds) Supercomputing. ISC 2014. Lecture Notes in Computer Science, vol 8488. Springer, Cham.
https://doi.org/10.1007/978-3-319-07518-1_25
- [2] Energy Aware Runtime on LRZ SuperMUC NG:
https://doku.lrz.de/energy-aware-runtime-10746191.html - [3] Hardware of SuperMUC-NG Phase 1.
https://doku.lrz.de/hardware-of-supermuc-ng-phase-1-11482553.html - [4] EAR on SURF Snellius:
https://www.surf.nl/en/energy-smart-computing - [5] Energy Aware Solutions
https://www.ear.energy - [6] Energy Aware Runtime Documentation
https://www.ear.energy/resources/ - [7] Energy accounting with EAR Documentation
https://github.com/eas4dc/EAR/wiki/EAR-commands#ear-job-accounting-eacct - [8] GPU profiling with EAR Documentation
https://github.com/eas4dc/EAR/wiki/Report#dcgmi - [9] EAR job visualization.
https://github.com/eas4dc/ear-job-visualization - [10] J. Corbalan, O. Vidal, L. Alonso and J. Aneas, "Explicit uncore frequency scaling for energy optimisation policies with EAR in Intel architectures," 2021 IEEE International Conference on Cluster Computing (CLUSTER), 2021, pp. 572-581, doi: 10.1109/Cluster48925.2021.00089.
- [11] J. Corbalan, L. Alonso, J. Aneas and L. Brochard, "Energy Optimization and Analysis with EAR," 2020 IEEE International Conference on Cluster Computing (CLUSTER), 2020, pp. 464-472, doi: 10.1109/CLUSTER49012.2020.00067.
- [12] EAR job accounting web page.
https://github.com/eas4dc/EAR/wiki/EAR-commands#ear-job-accounting-eacct - [13] Corbalan, J., Alonso, L., Brochard, L., Aneas, J., Vidal, O. (2026). Static Powercap vs. EAR Hard-Powercap: Performance Evaluation. In: Klusáček, D., Corbalán, J., Rodrigo, G.P. (eds) Job Scheduling Strategies for Parallel Processing. JSSPP 2025. Lecture Notes in Computer Science, vol 16210. Springer, Cham.
http://hhttps://doi.org/10.1007/978-3-032-10507-3_10 - [14] Julita Corbalan, Luigi Brochard, Jalal Lakhlili, Marco d'Amico, Oriol Vidal, and Jordi Aneas. 2025. Energy Data Center Monitoring and Management with EAR. In Proceedings of the 16th ACM International Conference on Future and Sustainable Energy Systems (E-Energy '25). Association for Computing Machinery, New York, NY, USA, 915–920.
https://doi.org/10.1145/3679240.3735105 - [15] Slurm® web page
https://slurm.schedmd.com/overview.html - [16] Slurm® SPANK plugin documentation
https://slurm.schedmd.com/spank.html - [17] Altair® PBS professional®
https://www.altair.com/pbs-professional - [18] Kubernetes
https://kubernetes.io - [19] Lenovo ThinkSystem SD665 V3 Neptune Server
https://lenovopress.lenovo.com/lp1612-lenovo-thinksystem-sd665-v3-server - [20] Lenovo ThinkSystem SC750 V4 Neptune Server
https://lenovopress.lenovo.com/lp2009-thinksystem-sc750-v4-neptune-server - [21] Grafana Labs
https://grafana.com/ - [22] Paraver visualization tool
https://tools.bsc.es/paraver
Author
Aurelien Ortiz is an HPC/AI Software Architect working as part of the Solutions Architect Team in the ISG Offerings Group at Lenovo. Aurelien helps customers, partners, and internal teams design, deploy, and optimize software stacks for HPC and AI environments, covering infrastructure management, orchestration, storage, networking, and AI platforms. He has over 15 years of experience working with HPC clusters, large-scale storage systems, and AI infrastructure. He holds a PhD in Computer Science with a specialization in Distributed Systems from the University of Toulouse, France.
Karsten Kutzer is Principal HPC/AI Solution Architect in the HPC Solutions and Server strategy department at Lenovo. He has a history of 25 years working in HPC, starting with deploying HPC clusters, then moving on to a role as an HPC architect. Since 2015 he has worked as HPC solution architect in Lenovo. His experience covers a wide range of topics from large-scale HPC clusters, servers, networking, storage and software stack as well as datacenter infrastructure and direct-water-cooling. He holds a degree of “Diplom Ingenieur (Technische Informatik)” from the Berufsakademie Mannheim.
Julita Corbalán is the team leader of the System software for energy management in HPC" group at Barcelona Supercomputing Center (BSC) and the co-founder of Energy Aware Solutions (EAS) – the company that drives the development of the Energy Aware Runtime (EAR) with Lenovo and provides installation services and technical support. Her research interests include processor management of parallel applications, parallel runtimes, scheduling policies and energy efficiency solutions for data centers. She received the engineering degree in computer science in 1996 and the PhD degree in computer science in 2002, both from the Technical University of Catalunya (UPC), Spain.
Luigi Brochard started his career at IBM as HPC architect and became IBM Distinguished Engineer in 2004. In 2011, he created the Energy Aware Scheduling technology and after moving to Lenovo in 2015 he started the collaboration with Barcelona Supercomputing Center (BSC) to develop Energy Aware Run time (EAR). He retired from Lenovo Data Center Group in 2018, co-authored the book “Energy-Efficient Computing and Data Centers” (published by Wiley in 2019) and co-founded Energy Aware Solutions (EAS) in 2020. Luigi Brochard holds a Ph.D. in Applied Mathematics and an HDR in Computer Science from Pierre et Marie Curie University in Paris, France.
Trademarks
Lenovo and the Lenovo logo are trademarks or registered trademarks of Lenovo in the United States, other countries, or both. A current list of Lenovo trademarks is available on the Web at https://www.lenovo.com/us/en/legal/copytrade/.
The following terms are trademarks of Lenovo in the United States, other countries, or both:
Lenovo®
Neptune®
ThinkSystem®
The following terms are trademarks of other companies:
Intel®, the Intel logo is a trademark of Intel Corporation or its subsidiaries.
IBM® is a trademark of IBM in the United States, other countries, or both.
NVIDIA® and NVLink® are trademarks of NVIDIA Corporation.
Other company, product, or service names may be trademarks or service marks of others.
Configure and Buy
Please select a locale
Full Change History
Course Detail
Employees Only Content
The content in this document with a is only visible to employees who are logged in. Logon using your Lenovo ITcode and password via Lenovo single-signon (SSO).
The author of the document has determined that this content is classified as Lenovo Internal and should not be normally be made available to people who are not employees or contractors. This includes partners, customers, and competitors. The reasons may vary and you should reach out to the authors of the document for clarification, if needed. Be cautious about sharing this content with others as it may contain sensitive information.
Any visitor to the Lenovo Press web site who is not logged on will not be able to see this employee-only content. This content is excluded from search engine indexes and will not appear in any search results.
For all users, including logged-in employees, this employee-only content does not appear in the PDF version of this document.
This functionality is cookie based. The web site will normally remember your login state between browser sessions, however, if you clear cookies at the end of a session or work in an Incognito/Private browser window, then you will need to log in each time.
If you have any questions about this feature of the Lenovo Press web, please email David Watts at dwatts@lenovo.com.


