

Top
Author
Published
9 Oct 2026Form Number
LP2530PDF size
16 pages, 706 KBSubscribed to LP2530.
Thank you for your feedback.
Table of Contents
- Introduction
- Accessing the CPU Sizing Tool
- Workloads and model sizes covered
- Intel Xeon 6 and Lenovo platform coverage
- Benchmark methodology: Throughput and interactive capacity
- Estimating untested CPU SKUs
- Estimating concurrent users
- Modeling whole-server power and cost
- Turning performance into Token Economics
- Adding the cloud dimension
- How to use the Sizing Tool
- Worked example: 8B RAG for 20 concurrent users
- Interpreting the sizing outputs
- The bigger picture: Workload-centric AI infrastructure
- Validation guardrails and known limitations
- References
- Benchmark and estimation disclaimer
- Author
- Related product families
- Trademarks
Abstract
Enterprise AI infrastructure planning increasingly depends on more than benchmark performance alone. This paper introduces a business-first CPU AI sizing and token economics tool for Lenovo ThinkSystem servers that are based on Intel Xeon 6 processors. The tool starts with the customer’s use case, model size, and concurrent-user requirements, then maps those needs to suitable server and CPU configurations. It combines inference throughput, latency-based capacity, server cost, power consumption, and cloud pricing to estimate metrics such as cost per million tokens, monthly operating cost, break even, and lifecycle savings.
This paper also explains the benchmarking, estimation, power-modeling, and economic methodologies behind the sizing tool and provides guidance for using it in customer planning discussions.
Sizing Tool: The CPU AI sizing tool is available at https://lenovopress.lenovo.com/llm-sizing-tool by clicking the CPU Sizing tab.
Introduction
As generative AI moves from experimentation into production, infrastructure planning becomes more than a benchmark comparison. Enterprises need to understand how model choice, workload characteristics, expected user demand, latency requirements, infrastructure cost, and energy consumption come together before deciding what to deploy.
Traditional benchmarking usually starts with the hardware: select a processor, run a workload, and report performance such as tokens per second. Those measurements are important, but they do not directly answer the questions customers typically ask.
The CPU AI Sizing tool was developed to connect two views, AI Sizing and Token Economics. It includes Intel Xeon 6 P-core processors ranging from 8 to 128 cores per processor in Lenovo ThinkSystem V4 servers and combines measured benchmark results with workload sizing, power modeling, server economics, and cloud comparisons.
The overall workflow of the tool is shown in the following figure.

Figure 1. Workflow of the tool
The four questions the CPU Sizing Tool is designed to answer:
- What size of model fits the use case?
- How many concurrent users can one server support while meeting the latency SLA?
- What throughput can the customer expect?
- What does that translate to in $/1M output tokens, power efficiency, upfront investment, monthly cost, and cloud economics?
Accessing the CPU Sizing Tool
To access the tool:
- Go to https://lenovopress.lenovo.com/llm-sizing-tool
- Click the CPU Sizing tab to display the tool.
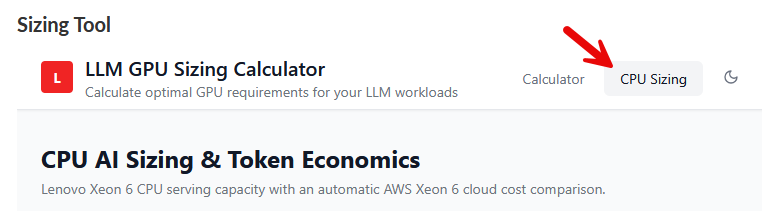
Figure 2. Click the CPU Sizing tab to display the tool
The tool starts with three business inputs, as shown in the figure below, rather than asking users to interpret a large matrix of benchmark results:
- Business use case
- Model size
- The number of concurrent users that is required
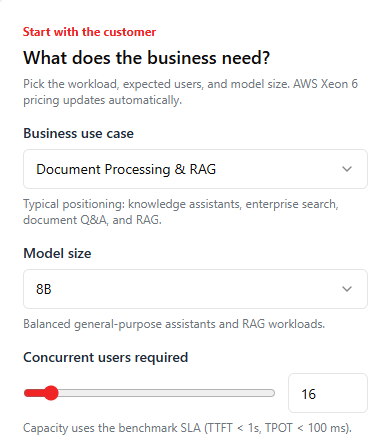
Figure 3. Three customer inputs from the CPU sizing tool
The sizing tool identifies server and CPU configurations that can meet the workload requirement and allows users to compare throughput, capacity headroom, server acquisition cost, cost per million output tokens, power efficiency, cloud economics, break even, and lifecycle savings.
The objective is not to identify one universally “best” CPU. It is to help identify the right-sized infrastructure for a particular workload and business requirement, and to translate AI benchmark results into metrics that customers, solution architects, sales teams, and business decision-makers can use.
For further instructions, see the How to Use the Sizing Tool section.
Workloads and model sizes covered
The sizing tool groups representative enterprise inference workloads into three business-oriented categories:
- Short Query & Classification
- Document Processing & RAG
- Full Document Analysis & Reporting
These categories provide a practical way to group workloads with similar performance and infrastructure characteristics for sizing purposes.
The following table summarizes the three workload categories, representative applications, and the primary infrastructure consideration associated with each workload type.
In addition to workload type, model size is a key sizing input because it directly affects compute requirements, throughput, concurrency, and infrastructure economics. The tool groups models into three size ranges to support practical capacity planning and configuration selection, as listed in the following table.
Note: Model size is an infrastructure-planning dimension, not a quality ranking. Application teams should separately evaluate task accuracy, reasoning quality, domain knowledge, safety, retrieval quality, and other use-case requirements.
Intel Xeon 6 and Lenovo platform coverage
The CPU sizing tool focuses on Intel Xeon 6 P-core processors. The benchmark matrix is intentionally not all-to-all: CPUs were tested on the Lenovo platforms where hardware was available, and additional P-core SKUs are estimated from a measured anchor on the same server platform.
Platforms covered in the tool are listed below:
- SR630 V4: a 2-socket 1U server supporting Xeon 6500/6700-series processors
- SR650 V4: a 2-socket 2U server supporting Xeon 6500/6700-series P-core processors
- SC750 V4: a 2-processor Neptune direct-water-cooled platform supporting Xeon 6900-series processors
The CPU sizing tool spans a broad range of Intel Xeon 6 P-core processors, allowing the tool to evaluate configurations from lower-core-count systems for lighter workloads through high-core-count platforms for greater throughput and concurrency. The following table summarizes the processor SKUs included in the sizing tool, their core counts, and the Lenovo ThinkSystem platforms on which they are supported.
The following table summarizes the Lenovo ThinkSystem platforms used for benchmarking, the Xeon 6 CPUs tested, and each platform’s profile.
Benchmark methodology: Throughput and interactive capacity
The benchmark evaluates two complementary performance modes to capture both maximum throughput and interactive serving capacity:
- Offline throughput
Offline throughput measures maximum output-token generation when interactive latency is not the primary constraint. It is useful for batch document processing, asynchronous generation, summarization pipelines, and other throughput-oriented workloads.
- Interactive serving
Interactive serving measures throughput and concurrency while maintaining a defined latency target. The sizing tool uses the following serving service level agreement (SLA):
Serving SLA:
- Time to First Token (TTFT) < 1 second
- Time per Output Token (TPOT) < 100 milliseconds
For each workload, the largest tested concurrency level that remains inside both thresholds becomes the measured Max Concurrent Users value. This translates engineering performance into a customer-facing capacity question: how many simultaneous users can this server support while maintaining the target response experience?
Estimating untested CPU SKUs
Testing every model, workload, CPU SKU, and server combination would create a very large matrix. To extend measured results into a practical sizing tool, the tool uses a compute-scaling estimation for untested P-core CPUs on the same server platform.
Throughput for an untested CPU is estimated by scaling the measured baseline throughput according to relative core count and base frequency:

The estimation assumes the same socket count, comparable memory and software configuration, no binding bandwidth ceiling, and scaling efficiency = 1. Offline and serving throughput are estimated independently of the appropriate platform anchor.
Example: SR650 V4 with Xeon 6724P, 8B RAG
The following table shows how the measured Xeon 6787P configuration is used as the baseline to estimate throughput for the Xeon 6724P.
Scaling factor = (16 × 3.6) ÷ (86 × 2.0) = 0.3349. Applying that factor gives approximately 204.24 serving output tok/s and 461.24 offline output tok/s. These values match the planning data used by the tool.
Approximation only: This is a capacity-planning approximation. It should not be interpreted as a substitute for a measured benchmark on the target CPU, especially when memory bandwidth, NUMA behavior, frequency behavior under sustained load, or software optimization changes materially.
Estimating concurrent users
For untested P-core configurations, concurrent-user capacity is estimated from the measured SLA baseline using the formula below, which scales baseline Max Users by the ratio of target to baseline serving throughput.

For the same SR650 V4 8B RAG example, the baseline is 32 users at 609.89 tok/s and the estimated target is 204.24 tok/s. Therefore, 32 × 204.24 ÷ 609.89 = 10.72, which rounds to 11 users.
The HTML application uses Max Users as a capacity filter: a configuration “fits” only when its modeled Max Users is at least the customer’s requested concurrent users.
Production SLA caveat: Estimated Max Users values are planning estimates, not measured SLA results. Validate the target configuration on hardware before presenting an estimated concurrency value as a formal production commitment.
Modeling whole-server power and cost
Power-supply capacity is not the same as server power consumption. A 2,000 W or 3,200 W PSU rating defines available power-delivery capacity; it does not mean the server continuously consumes that amount.
For token economics, the relevant quantity is whole-server AC input power while processing the workload. For unmeasured SR630 V4 and SR650 V4 P-core configurations, the tool scales the dynamic power above the measured idle baseline by CPU TDP:
Target Load Power = Reference Idle Power + (Reference Load Power − Reference Idle Power) × (Target CPU TDP / Reference CPU TDP)
Example using the SR650 V4 reference: idle power = 543.5 W, reference workload power = 1,086.8 W, reference 6787P TDP = 350 W, and target 6724P TDP = 210 W. The modeled target load power is approximately 869.5 W.
For SC750 V4, the current economics layer uses a conservative modeled direct-water-cooled node power until workload-level node telemetry is available. All power estimates should be replaced with measured platform telemetry whenever formal customer claims are required.
Turning performance into Token Economics
Performance becomes a business metric only after it is combined with acquisition cost, utilization, electricity, data-center efficiency, and lifecycle assumptions.
The following table listed out the default assumptions used in the token-economics calculation, which can be adjusted for customer-specific lifecycle, utilization, electricity cost, and PUE.
The core financial calculations used here are as follows:
Monthly Amortized CAPEX = Server Package Cost / (Lifecycle Years × 12)
Monthly Energy + Cooling = Load Power kW × Active Hours/Day × Days/Month × Electricity Rate × PUE
Monthly All-In Cost = Monthly Amortized CAPEX + Monthly Energy + Cooling + Other Monthly OPEX
Token economics metrics are listed in the following table.
TCO metric distinction: Serving Full TCO uses a monthly all-in cost. Serving CAPEX-only isolates monthly amortized server CAPEX as a separate $/1M output-token metric.
Adding the cloud dimension
Cloud infrastructure is priced in dollars per instance-hour, while AI consumption is increasingly discussed in dollars per token. The tool converts hourly rental into the same token-economic unit used for on-prem inference:
Cloud $/1M Output Tokens = Cloud Rental $/Hour ÷ (Cloud Output tok/s × 3,600 ÷ 1,000,000)
The current comparison uses Intel Xeon 6–based AWS memory-optimized instance families, US East (N. Virginia), Linux, shared tenancy, 1 TiB RAM per instance, and both On-Demand and 3-Year EC2 Instance Savings Plan No Upfront purchasing models. The commercial comparison currently uses two AWS instances per Lenovo server as a planning assumption.
When measured AWS inference throughput is unavailable, cloud throughput is normalized to the selected Lenovo configuration. This creates a capacity-normalized planning comparison; it is not a measured cloud benchmark. Enter measured aggregate AWS throughput in Advanced assumptions when available.
Lifecycle savings and rank
Lifecycle savings compares the modeled cost of cloud rental with the total on-premises cost over the selected period. This value is also used to rank configurations by their long-term economic benefit.
5-Year Net Savings = 5-Year Cloud Rental Cost − (Upfront Server Package Cost + 5-Year On-Prem Cash OPEX)
The sizing tool ranks only configurations that meet the requested concurrent-user capacity. Rank #1 is the configuration with the highest modeled lifecycle savings versus AWS On-Demand; ties are broken by higher savings versus the 3-Year No-Upfront plan, then by lower Lenovo package price. This is an economic rank—not a model-quality or benchmark-performance rank.
How to use the Sizing Tool
The tool can be accessed at https://lenovopress.lenovo.com/llm-sizing-tool and then clicking the CPU Sizing tab as described in the Accessing the CPU Sizing Tool section.
The interface is designed for sales, marketing, solution architects, and customers who do not want to interpret a raw benchmark matrix. The recommended workflow is as follows:
- Select the business use case: Short Query & Classification, Document Processing & RAG, or Full Document Analysis & Reporting.
- Select the model size: 1B–3B, 8B, or 14B–20B.
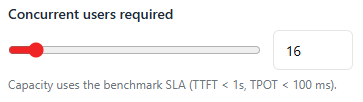
- Enter the required concurrent users. This becomes the capacity threshold used to filter the server/CPU options.
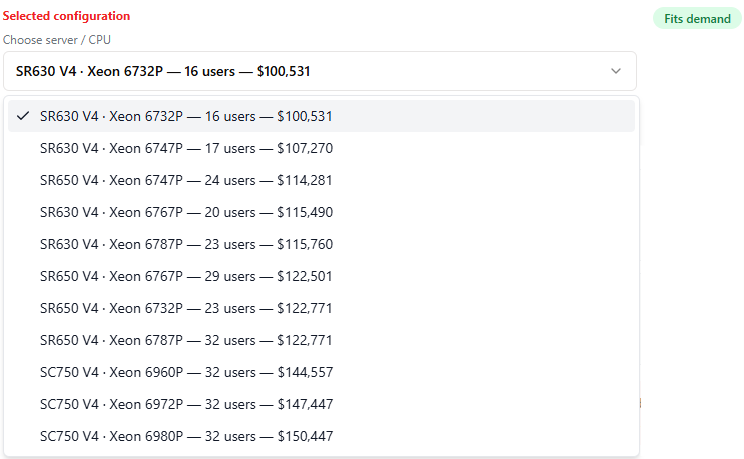
- Review the server/CPU dropdown. The servers listed means the configurations that meet the requested user target under the sizing model; options are ordered by the current 5-year savings rank.
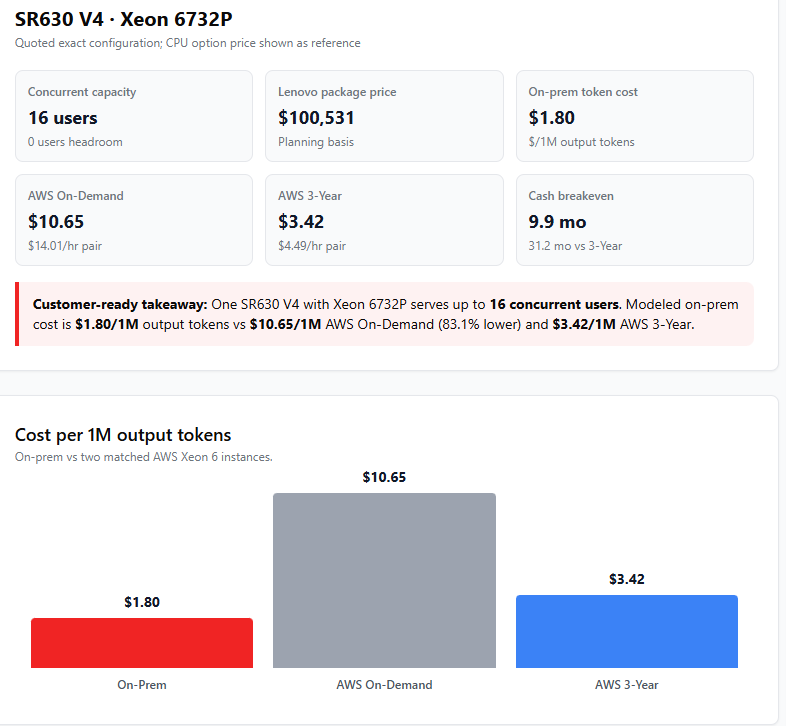
- Select any configuration to update capacity headroom, server package price, on-prem $/1M tokens, cloud $/1M, cash breakeven, lifecycle savings, and charts.
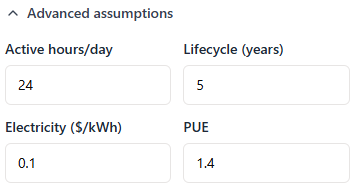
- Use Advanced assumptions to change active hours/day, lifecycle, electricity rate, PUE, or to enter measured aggregate cloud throughput.
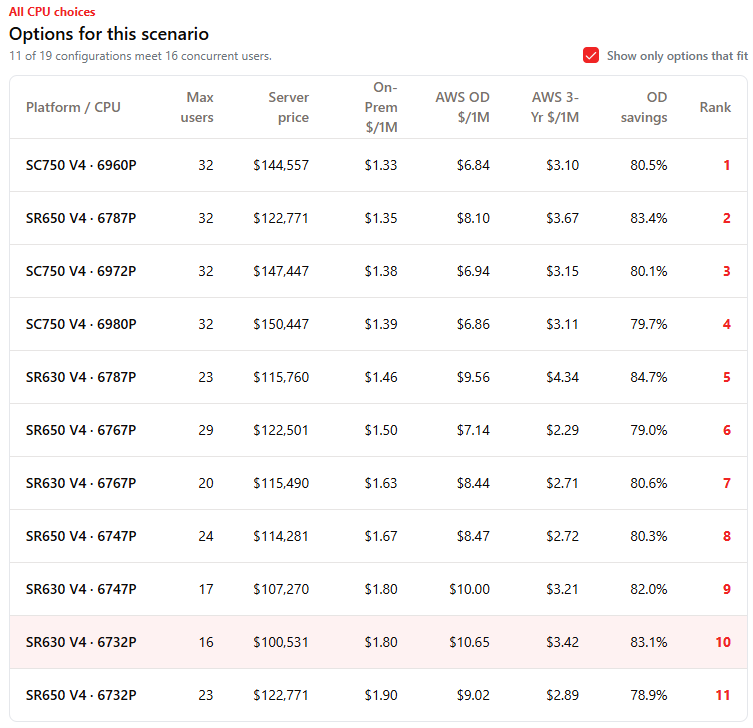
- Use the options table to compare all CPU choices and the Print / Save PDF action to capture a customer-ready view.
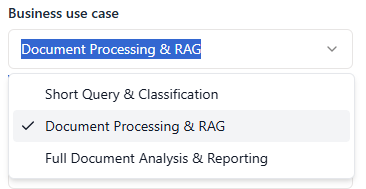
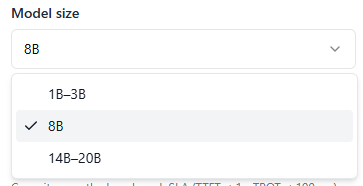
Worked example: 8B RAG for 20 concurrent users
To illustrate the user flow, assume an enterprise knowledge assistant with an 8B model, Document Processing & RAG workload, and a requirement for 20 concurrent users. Under the current default financial assumptions, the tool first removes configurations whose Max Users is below 20, then ranks the remaining options by modeled 5-year savings versus AWS On-Demand.
The following table shows the server configurations for this scenario and compares their capacity, throughput, package cost, on-prem token cost, and modeled 5-year savings versus AWS On-Demand.
This example demonstrates why the ranking is not simply “highest throughput” or “lowest purchase price.” The rank combines the scenario’s capacity with the modeled lifecycle economics. A different user target, model size, utilization level, or cloud throughput assumption can change the order.
How to consider the result: You may prefer Rank #1 for modeled lifecycle savings, but another option can still be the better design when more headroom, measured rather than estimated performance, rack density, expansion, cooling strategy, or standardization matters. The tool supports comparison; it does not replace architecture judgment.
Interpreting the sizing outputs
The sizing tool produces both technical and economic outputs. The following table summarizes what each metric represents and how it can be interpreted when evaluating infrastructure options.
Together, these metrics provide a more complete view than throughput alone by connecting workload capacity and latency requirements with acquisition cost, operating cost, power efficiency, and cloud economics.
The bigger picture: Workload-centric AI infrastructure
There is no single infrastructure platform that is optimal for every AI workload. GPU infrastructure remains important for training, very large models, and the most demanding inference. Cloud infrastructure offers rapid access and flexible capacity. CPU-based infrastructure can be a practical production option for smaller and mid-sized models, predictable workloads, moderate concurrency, governance-sensitive applications, and sustained inference demand.
The better infrastructure question: Not “Can CPUs replace GPUs?” but “What infrastructure delivers the required application experience at the right business cost?”
That is the philosophy behind CPU AI Sizing & Token Economics: connect the business use case, model size, concurrency, latency, throughput, processor choice, server CAPEX, energy consumption, and cost per token so infrastructure planning becomes workload-driven and economically transparent.
Validation guardrails and known limitations
The following guardrails clarify where the sizing results are measured, modeled, or assumption-based, and where additional validation is recommended before using them for production planning or formal commitments:
- The benchmark matrix is not all-to-all. Measured configurations and planning estimates coexist in the underlying model.
- Throughput scaling assumes comparable platform configuration and compute-limited behavior. Memory bandwidth, NUMA topology, frequency under load, software versions, quantization, and kernel/framework optimizations can change real scaling.
- Estimated Max Users is derived from throughput scaling and must be validated before being used as a formal SLA commitment.
- Load power for unmeasured SKUs is modeled. Measured XCC/SMM/platform telemetry is preferred for formal power and TCO claims.
- Additional monthly OPEX is currently a placeholder. Colocation, maintenance, networking, administration, financing, and other local costs should be added when relevant.
- Cloud pricing changes over time, and cloud throughput should be measured for a formal apples-to-apples comparison. The current normalized-throughput mode is a planning assumption.
- The economic rank is scenario-specific and should not be interpreted as a model-quality ranking or universal hardware recommendation.
References
For more information, see the following resources:
- Lenovo ThinkSystem SR630 V4 Product Guide
https://lenovopress.lenovo.com/lp1971-thinksystem-sr630-v4-server - Lenovo ThinkSystem SR650 V4 Product Guide
https://lenovopress.lenovo.com/lp2127-thinksystem-sr650-v4-server - Lenovo ThinkSystem SC750 V4 Neptune Product Guide
https://lenovopress.lenovo.com/lp2009-thinksystem-sc750-v4-neptune-server - Intel Xeon Processors
https://www.intel.com/content/www/us/en/products/details/processors/xeon.html - Amazon EC2 X8i Instances — Intel Xeon 6
https://aws.amazon.com/ec2/instance-types/x8i/ - Amazon EC2 R8i Instances — Intel Xeon 6
https://aws.amazon.com/ec2/instance-types/r8i/ - AWS EC2 On-Demand Pricing
https://aws.amazon.com/ec2/pricing/on-demand/ - AWS Savings Plans — What are Savings Plans?
https://docs.aws.amazon.com/savingsplans/latest/userguide/what-is-savings-plans.html
Benchmark and estimation disclaimer
Performance results were obtained under specific benchmark configurations and workloads. Directly tested results represent those environments. Values calculated for untested CPU SKUs—including throughput, concurrent-user capacity, load power, token economics, cloud comparisons, breakeven, and lifecycle savings—are capacity-planning estimates derived from the methodology described in this article.
Actual results can vary based on processor configuration, memory, software stack, model implementation, quantization, workload characteristics, system utilization, power configuration, cloud instance performance, pricing, and other environmental factors. Estimated configurations should be validated on the target hardware before being used for formal performance, power, cost, or SLA commitments.
Author
Kelvin He is an AI Data Scientist at Lenovo. He is a seasoned AI and data science professional specializing in building machine learning frameworks and AI-driven solutions. Kelvin is experienced in leading end-to-end model development, with a focus on turning business challenges into data-driven strategies. He is passionate about AI benchmarks, optimization techniques, and LLM applications, enabling businesses to make informed technology decisions.
Trademarks
Lenovo and the Lenovo logo are trademarks or registered trademarks of Lenovo in the United States, other countries, or both. A current list of Lenovo trademarks is available on the Web at https://www.lenovo.com/us/en/legal/copytrade/.
The following terms are trademarks of Lenovo in the United States, other countries, or both:
Lenovo®
Neptune®
ThinkSystem®
The following terms are trademarks of other companies:
Intel®, the Intel logo and Xeon® are trademarks of Intel Corporation or its subsidiaries.
Linux® is the trademark of Linus Torvalds in the U.S. and other countries.
Other company, product, or service names may be trademarks or service marks of others.
Configure and Buy
Please select a locale
Full Change History
Course Detail
Employees Only Content
The content in this document with a is only visible to employees who are logged in. Logon using your Lenovo ITcode and password via Lenovo single-signon (SSO).
The author of the document has determined that this content is classified as Lenovo Internal and should not be normally be made available to people who are not employees or contractors. This includes partners, customers, and competitors. The reasons may vary and you should reach out to the authors of the document for clarification, if needed. Be cautious about sharing this content with others as it may contain sensitive information.
Any visitor to the Lenovo Press web site who is not logged on will not be able to see this employee-only content. This content is excluded from search engine indexes and will not appear in any search results.
For all users, including logged-in employees, this employee-only content does not appear in the PDF version of this document.
This functionality is cookie based. The web site will normally remember your login state between browser sessions, however, if you clear cookies at the end of a session or work in an Incognito/Private browser window, then you will need to log in each time.
If you have any questions about this feature of the Lenovo Press web, please email David Watts at dwatts@lenovo.com.


