

Top
Author
Published
19 Feb 2026Form Number
LP2371PDF size
14 pages, 382 KBSubscribed to LP2371.
Thank you for your feedback.
Abstract
In Part 1 of this paper series, we implemented and evaluated a Standard RAG pipeline focused on text-only workloads, establishing latency and scalability baselines on CPU platforms. In Part 2, we extended the framework to Multimodal RAG, incorporating vision-language models (VLMs) to enable image-aware reasoning and response generation.
In this Part 3 study, we further deepen the analysis by examining the latency–quality tradeoff in Multimodal RAG, comparing three distinct architectural designs. This evaluation provides a structured understanding of how retrieval strategy, embedding modality, and generation pipeline choices influence both system performance and answer quality.
Using our benchmark runs, we observe a consistent tradeoff: architectures that avoid VLM summarization minimize indexing latency, while architectures that pass raw images to the answer model can improve visual grounding at the cost of additional multimodal generation overhead.
This paper is written for AI system architects, enterprise ML engineers, product teams building AI copilots, and infrastructure decision makers seeking to deploy multimodal RAG at scale. Readers will gain an understanding of practical performance expectations, model behavior across precisions, and how Intel technologies can support GPU-like multimodal inference without the operational overhead of accelerators.
Introduction
Retrieval-Augmented Generation (RAG) is commonly described as combining parametric generation with non-parametric retrieval over a vector index. This Part 3 in our series of papers on RAG is a latency-first study of three multimodal RAG system designs.
Other papers in this series:
These multimodal RAG system designs differ in three ways:
- Whether images are summarized into text
- Whether raw images are used at answer time
- Whether retrieval uses text embeddings or multimodal embeddings
We define an end-to-end (E2E) latency methodology that separates index-time latency (document ingestion + indexing) from query-time latency (retrieve + generate). Before the E2E comparison, we quantify two key contributors to latency variance:
- Multimodal embedding dimension vs embedding throughput
- Multimodal generation responsiveness vs image resolution and visual tokenization, including a controlled complexity study using synthetic patterns.
Benchmark areas we will cover:
- Embedding-size sensitivity: how vector dimension (and model choice) changes retrieval and overall latency.
- Latency breakdowns: ingest → summarize (if any) → embed → index → retrieve → generate.
- E2E latency under three architecture Architectures.
Experimental Design
This section outlines the evaluation framework used to compare the three multimodal RAG architectures under consistent latency and quality criteria. The design ensures controlled measurement of retrieval effectiveness, generation quality, and system-level performance trade-offs across all configurations.
Metrics
We measure index-time and query-time separately, plus streaming responsiveness:
Index-time latency:
- PDF parsing / content extraction time
- Image summarization time (Architectures 1–2 only)
- Embedding generation time (text and/or image)
- Vector store creation + indexing time
- Total indexing time
Query-time latency:
- Retrieval latency (ANN search)
Streaming breakdown:
- TTFT (time-to-first-token): responsiveness
- TPOT (time per output token): throughput proxy
Embedding-Size Benchmark Matrix
For each Architecture, we benchmark on different size of embeddings. The clean way to do this is to hold everything constant and vary only the embedding model dimension.
Multimodal embedding sizes: Small/Medium/Large depending on the chosen multimodal embedder (often 512-1024 + effective dims in CLIP-like families).
- 3 Multimodal embedding model sizes (CLIP-style multimodal representations):
- Small: 512-d
- Medium: 768-d
- Large: 1024-d
- 8 square resolutions: 224, 336, 384, 448, 512, 672, 896, 1024
- Each resolution repeated 10 times → 80 samples/model
- 4 image complexity patterns: Gradient, Solid, Checkerboard, Noise
Architectures Under Test
To systematically evaluate design trade-offs in multimodal RAG, we implemented three representative architectural patterns that differ in retrieval strategy, modality handling, and generation workflow. The following describes the framework of three architectures.
- Architecture 1: “Summarize → Text Retrieval → Text-only Answer”
- Use a multimodal LLM (VLM) to produce text summaries from images.
- Embed all content as text (image summaries + tables + text).
- Pass retrieved text to a text LLM for answer generation.
- Architecture 2: “Summarize → Text Retrieval + Image Refs → Multimodal Answer”
- Use a VLM to create text summaries from images.
- Embed summaries and retrieve them, preserving references to original images.
- Pass raw image(s) + retrieved text chunk(s) to a VLM for answer generation.
- Architecture 3: “Multimodal Embeddings → Multimodal Retrieval → Multimodal Answer”
- Use a multimodal embedding model (e.g., CLIP-style) to embed images directly.
- Retrieve relevant images (and associated text chunks) via similarity search over multimodal vectors.
- Pass the retrieved raw image(s) and text chunk(s) to a VLM for answer generation.
Results
This section presents the benchmark results in a bottom-up way. We first isolate two components that frequently dominate multimodal RAG latency:
- Multimodal embedding speed as a function of embedding dimension and input resolution
- Multimodal generation latency as a function of image resolution (visual tokens) and image complexity
We then connect these component measurements to the end-to-end indexing and query latency observed across the three RAG architectures.
Embedding Results
To isolate the cost of multimodal retrieval in Architecture 3, we benchmark CLIP-style image embedding across three model sizes (512, 768, and 1024 dimensions). We report per-image embedding latency and throughput over multiple input resolutions to quantify how embedding dimension and image size affect ingestion and query-time embedding overhead.
Key takeaway: Moving from 512 → 768 → 1024 dimensions in these runs produces a large step-up in embedding time (around 10× from 512 to 768, then around 1.45× from 768 to 1024).
Embedding Speed vs Resolution Input
Comparing mean time at the smallest vs largest resolution (224² vs 1024²):
- 512-d: ~0.0302s → ~0.0508s (~1.68×)
- 768-d: ~0.3936s → ~0.4240s (~1.08×)
- 1024-d: ~0.6079s → ~0.6187s (~1.02×, effectively flat within noise)
In this setup, we found that resolution has minor impact on medium/large embedding models and moderate impact on small embedding models. Dimension remains the dominant factor.
Multimodal Generation Speed vs Pixel Size and Pattern Complexity
This section characterizes the latency behavior when a VLM must process raw images (relevant to Architecture 2 and Architecture 3 answer generation).
Resolution scaling on Generation Latency
To understand the query-time cost of using raw images (Architectures 2 and 3), we measure how the vision-language model's latency scales with input resolution. We use a simple gradient image to keep content constant while increasing pixel count, and report both time-to-first-token (TTFT) and time per output token (TPOT). This isolates the image encoding and prefill overhead from the downstream text decoding rate.
Key takeaways: TTFT is almost linear in visual tokens. Fitting a simple linear model to 8 our resolution points shows TTFT is well-approximated by:
TTFT ≈ 0.102 + 0.00116 × (visual_tokens)
For this VLM configuration, the “cost to start responding” is driven far more by how many visual tokens the encoder produces than by the downstream text decoding rate (TPOT).
Pattern complexity comparison at fixed resolution
We tested solid, gradient, checkerboard, and noise at the same resolution. The visual token count is identical across patterns (so the VLM’s image-encoding workload is basically the same), and the measured latency differences are tiny.
With 512×512 images
- TTFT range across patterns: 0.4442s → 0.4528s (Δ ≈ 0.009s, ~1.9% of mean)
- TPOT range across patterns: 0.05865 → 0.05992 s/token (Δ ≈ 0.0013, ~2.1% of mean)
With 1024×1024 images
- TTFT range across patterns: 1.7800s → 1.7948s (Δ ≈ 0.015s, ~0.83% of mean)
- TPOT range across patterns: 0.05970 → 0.06051 s/token (Δ ≈ 0.0008, ~1.35% of mean)
Key takeaways: Across synthetic complexity patterns (solid/gradient/checkerboard/noise), TTFT and TPOT vary by less than ~2% at fixed resolution, while increasing resolution from 512² to 1024² increases TTFT by ~4× with negligible TPOT change. This indicates image resolution (not pixel-level complexity) is the primary determinant of multimodal generation responsiveness in this configuration.
End to End Latency Summary
We tested the End-to-End comparison on a popular paper, Attention is All You Need, across 3 architectures.
- Vision Language Model: OpenVINO/Qwen2-VL-7B-Instruct-fp16-ov
- Large Language Model: meta-llama/Llama-3.1-8B-Instruct converted to OpenVINO IR
- Multimodal Embedding Model : openai/clip-vit-base-patch32
- Text Embedding Model: sentence-transformers/all-MiniLM-L6-v2
- Vector Database: Redis
Indexing Total Time
This subsection reports the one-time indexing cost to prepare the corpus for retrieval. We decompose total indexing time into document loading, image-to-text summarization (Architectures 1-2 only), and ingest/index construction. Index Total Time (s) = Document Loading + Image-to-Text Summarization + Ingest.
Key Takeaway: architecture 3 indexes ~4.4× faster than architecture 1 and 2 because it eliminates image summarization, which dominates index time for architecture 1 and 2.
Generation Phase Time
Next, we analyze the query-time path by separating retrieval latency from generation latency. We report retrieval time, time-to-first-token (TTFT), and time-per-output-token (TPOT) to capture both responsiveness and decoding speed.
Estimated Generation (s) = TTFT + TPOT × Answer Length
Key Takeaway: architecture 2 has the fastest retrieval, while architecture 1 has the best TTFT/TPOT.
Retrieval and Generation Quality
To assess the qualitative performance of the three multimodal RAG architectures, we conducted an automated evaluation using a preloaded VLM Qwen2-VL-7B as the judge model. The evaluation was performed with over 50 representative questions, resulting in averaged scores across 50 total evaluations per architecture. The judge model evaluated the retrieval metrics: Precision@5, MRR, nDCG@5, and responses metrics: answer relevance, groundedness, and context coverage, providing a structured comparison of reasoning quality and evidence alignment across architectures.
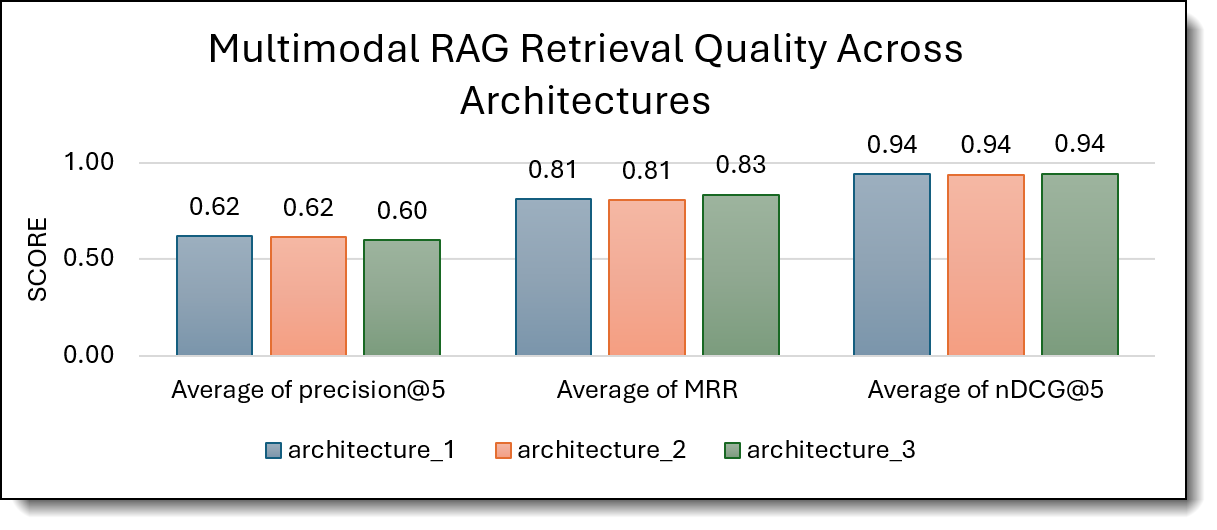
Figure 1. Multimodal RAG Retrieval Quality Chart
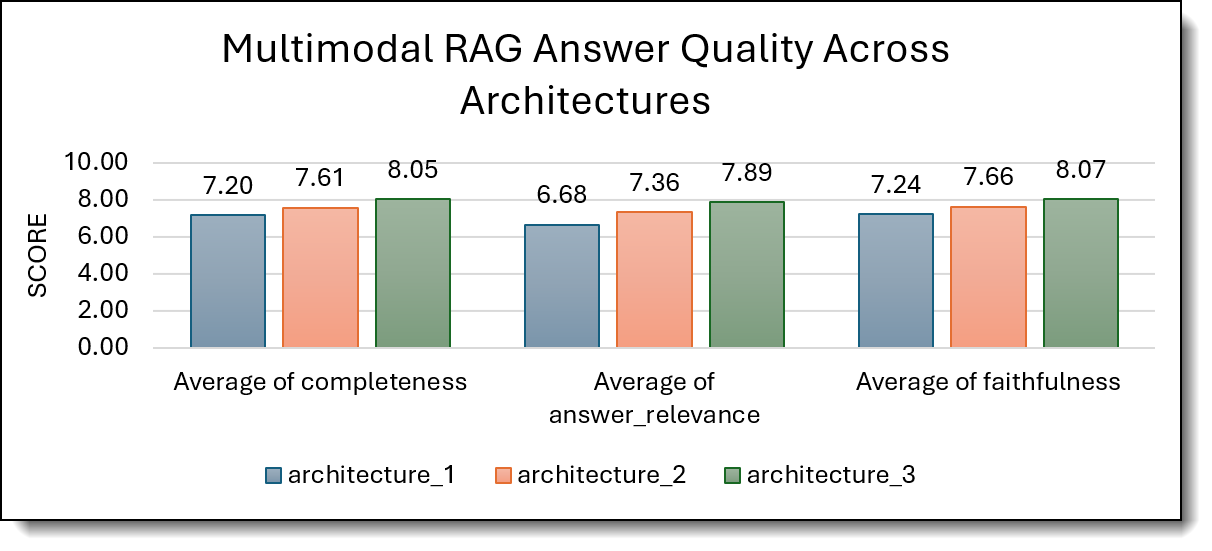
Figure 2. Multimodal RAG Answer Quality Chart
Key Takeaways
- Architecture 3 delivers the strongest answer quality, indicating that multimodal embedding–based retrieval can improve completeness and faithfulness when paired with multimodal generation.
- Architecture 2 provides the best retrieval precision, suggesting that text-mediated retrieval improves top-k relevance.
- Architecture 1 is the most stable baseline, but does not outperform the hybrid or fully multimodal designs.
Overall, hybrid or multimodal retrieval strategies outperform text-only pipelines in both ranking effectiveness and answer quality.
Conclusion and Implementation Recommendation
This section summarizes the practical tradeoffs observed in the benchmarks and translates them into implementation guidance. We focus on how indexing cost, retrieval latency, and multimodal generation overhead interact to determine overall end-to-end latency and user experience.
Architecture Recap and Conclusion
We recap the three architectures and highlight where each one fits best. The goal is not to declare a single universal winner, but to make the latency and quality trade-offs explicit so teams can choose the right design for their workload and constraints.
The following table summarizes the structural differences among the three multimodal RAG architectures, highlighting variations in image processing, embedding strategy, retrieval type, and generation workflow.
The following compares the three architectures across key performance dimensions, including indexing efficiency, response latency (TTFT), answer quality, and retrieval behavior.
The following summary highlights the fundamental trade-offs between indexing cost, retrieval strategy, and answer-time performance across the three multimodal RAG architectures.
Index-Time vs Query-Time Dominance:
- Architectures 1–2: dominated by summarization latency (VLM compute). Unless summarization is cached/reused across many queries, this pushes total time up.
- Architecture 3: dominated by extraction + embedding + index build; avoids summarization entirely.
Retrieval Quality vs Latency:
- Architecture 1 can be fast in streaming responsiveness and cheaper at answer time, but risks losing fine-grained visual details because images are reduced to summaries.
- Architecture 2 preserves visual fidelity at answer time while keeping retrieval in a text space; it is a strong balanced design for charts/figures.
- Architecture 3 bets on multimodal embedding quality to retrieve the right images without summarization; this can be excellent for “find the figure/screenshot” tasks but can degrade if the embedding model struggles with domain visuals.
Implementation Recommendation
Based on the measurements above, we provide a simple decision guide that maps common enterprise use cases (fast document onboarding, interactive Q&A, visually grounded answers) to the architecture that best matches the latency and quality requirements.
* Concurrent users measured under SLA constraints: TTFT ≤ 10s and TPOT ≤ 130ms on Intel Xeon 6787P with OpenVINO.
The results demonstrate that architectural choice directly influences scalability, latency, and deployment cost:
- Architecture 1 maximizes concurrency and is best suited for high-scale, text-dominant enterprise deployments.
- Architecture 2 offers a balanced approach, combining improved retrieval precision with strong multimodal reasoning for general enterprise assistants.
- Architecture 3 delivers the highest answer completeness and faithfulness, making it ideal for premium, reasoning-intensive multimodal use cases, albeit with lower concurrency.
These findings provide clear guidance for aligning multimodal RAG system design with product goals, infrastructure budgets, and SLA commitments.
Additional papers on RAG
This paper is Part 3 of 4 of a series of papers on Retrieval Augmented Generation.
The papers in the series are as follows:
- Part 1: Standard Retrieval-Augmented Generation: implement and benchmark a text-only RAG pipeline on Intel platforms, evaluate embedding and generation model combinations, and quantify retrieval latency, TTFT, TPOT, and throughput to establish CPU-first performance baselines from search to answer generation. Read the paper here: Standard Retrieval Augmented Generation on Intel: From Search to Answers
- Part 2: Multimodal RAG: extend the standard pipeline to support cross-modal retrieval and grounding (e.g., text with images/tables/code), compare hybrid indexes and multimodal encoders/LLMs, and quantify modality-aware latency and throughput alongside retrieval quality. Read the paper here: Accelerating Multimodal RAG with Intel Xeon and OpenVINO: When Vision Meets Language
- Part 3: This paper
- Part 4: Agentic Long-Context RAG: introduce planning and tool use with validation loops (self-check, re-query, re-rank), add long-context memory, and evaluate end-to-end task success, stability across multi-step trajectories, and cost–latency trade-offs. Coming soon.
System Configuration
The configuration of the server used in our testing is as follows:
- CPU: Intel Xeon 6787P processor, 86 cores / 172 threads @ 3.8 GHz
- GPU: None
- Memory: 16x 64 GB DDR5 @ 6400 GHz
- Cache: 336 MB
- OS: Ubuntu 22.04.5 LTS (Linux kernel 6.8.0-59-generic)
- Python: 3.12.3
- OpenVINO: 2025.4.0-20398
- Transformer: 4.45.0
Resources
This paper is Supplemental to the Part 2 on Retrieval Augmented Generation Series. Please check out detailed throughput and number of concurrent users test in Part 2.
Part 1: Standard Retrieval Augmented Generation on Intel: From Search to Answers
https://lenovopress.lenovo.com/lp2322-standard-retrieval-augmented-generation-on-intel-from-search-to-answers
Part 2: Accelerating Multimodal RAG with Intel Xeon and OpenVINO: When Vision Meets Language
https://lenovopress.lenovo.com/lp2350-accelerating-multimodal-rag-with-intel-xeon-and-openvino
For more information, see these resources:
- Lewis et al. “Retrieval-Augmented Generation for Knowledge-Intensive NLP.” arXiv:2005.11401
https://arxiv.org/abs/2005.11401 - MuRAG: Multimodal Retrieval-Augmented Generator for Open Question Answering over Images and Text
https://arxiv.org/abs/2210.02928 - OpenVINO Toolkit:
https://www.intel.com/content/www/us/en/developer/tools/openvino-toolkit/overview.html - OpenVINO GenAI Model:
https://openvinotoolkit.github.io/openvino.genai/docs/use-cases/image-processing/ - Huggingface OpenVINO Toolkit:
https://huggingface.co/OpenVINO/collections - Intel Advanced Matrix Extensions (Intel AMX):
https://www.intel.com/content/www/us/en/products/docs/accelerator-engines/what-is-intel-amx.html - Intel Xeon 6787P (Intel Xeon 6 / Granite Rapids) product page:
https://www.intel.com/content/www/us/en/products/sku/241844/intel-xeon-6787p-processor-336m-cache-2-00-ghz/specifications.html
Model cards:
- OpenVINO/Qwen2-VL-7B-Instruct-fp16-ov
https://huggingface.co/OpenVINO/Qwen2-VL-7B-Instruct-fp16-ov - meta-llama/Llama-3.1-8B-Instruct
https://huggingface.co/meta-llama/Llama-3.1-8B-Instruct - sentence-transformers/all-MiniLM-L6-v2
https://huggingface.co/sentence-transformers/all-MiniLM-L6-v2 - openai/clip-vit-large-patch14
https://huggingface.co/openai/clip-vit-large-patch14 - openai/clip-vit-base-patch32
https://huggingface.co/openai/clip-vit-base-patch32 - laion/CLIP-ViT-H-14-laion2B-s32B-b79K
https://huggingface.co/laion/CLIP-ViT-H-14-laion2B-s32B-b79K
Author
Kelvin He is an AI Data Scientist at Lenovo. He is a seasoned AI and data science professional specializing in building machine learning frameworks and AI-driven solutions. Kelvin is experienced in leading end-to-end model development, with a focus on turning business challenges into data-driven strategies. He is passionate about AI benchmarks, optimization techniques, and LLM applications, enabling businesses to make informed technology decisions.
Trademarks
Lenovo and the Lenovo logo are trademarks or registered trademarks of Lenovo in the United States, other countries, or both. A current list of Lenovo trademarks is available on the Web at https://www.lenovo.com/us/en/legal/copytrade/.
The following terms are trademarks of Lenovo in the United States, other countries, or both:
Lenovo®
The following terms are trademarks of other companies:
Intel®, the Intel logo, OpenVINO®, and Xeon® are trademarks of Intel Corporation or its subsidiaries.
Linux® is the trademark of Linus Torvalds in the U.S. and other countries.
Other company, product, or service names may be trademarks or service marks of others.
Configure and Buy
Please select a locale
Full Change History
Course Detail
Employees Only Content
The content in this document with a is only visible to employees who are logged in. Logon using your Lenovo ITcode and password via Lenovo single-signon (SSO).
The author of the document has determined that this content is classified as Lenovo Internal and should not be normally be made available to people who are not employees or contractors. This includes partners, customers, and competitors. The reasons may vary and you should reach out to the authors of the document for clarification, if needed. Be cautious about sharing this content with others as it may contain sensitive information.
Any visitor to the Lenovo Press web site who is not logged on will not be able to see this employee-only content. This content is excluded from search engine indexes and will not appear in any search results.
For all users, including logged-in employees, this employee-only content does not appear in the PDF version of this document.
This functionality is cookie based. The web site will normally remember your login state between browser sessions, however, if you clear cookies at the end of a session or work in an Incognito/Private browser window, then you will need to log in each time.
If you have any questions about this feature of the Lenovo Press web, please email David Watts at dwatts@lenovo.com.


